
![]()
This blog post will give a quick review of all the Q/A that were discussed in our Microsoft Data Analyst Associate Day 9 Live Session, which helps you to gain a better understanding and make it easier for you to learn the Microsoft Data Analyst Associate, clear the [DA100] Certification & get a better-paid job.
In this blog, we are going to share some quick tips, including Q/A and Important topics from Day 9 of Microsoft Data Analyst, Covering Module 11: Create and Manage Workspaces in Power BI, Where we covered topics like Create Workspaces, Monitor usage, and Performance, Data Linage, Configure data Protection, etc.
On Day 8 Session, we covered an overview of Perform Advance Analytics In PowerBI.
A week before, on Day 7 Session, we covered an overview of Create a Dashboards and Paginated Reports in Power BI.
> Create a Workspaces
Workspace is the centralized repository in which you can collaborate with colleagues and teams to create collections of reports and dashboards.
Create Workspace by following below steps:
- Go to Power BI service.
- Select the Workspaces drop-down menu.
- Select the Create a workspace button at the bottom of the resulting panel.

- In the Create a workspace window, enter information in the Workspaces name and Description fields and then upload a Workspace image.

- In the Advanced drop-down menu, you can create a Contact list of users who will receive notifications if issues with the Workspace occur.
- After you have filled out pertinent fields on the Create a workspace window, select Save.
Also Check: Our blog post on Power bi Service.
> Monitor Usage and Performance
Knowing about the usage and performance of your Workspace is crucial because it:
- Focuses your efforts on improvement. If you know the areas where the performance is least, you can concentrate your efforts for improvement in those areas.
- Quantifies the impact of your reports. Usage metrics help you determine your reports’ success.
These performance and usage metrics are available features that you can use in a workspace. With these metrics, you can view who’s using your reports, what actions are being done, and what performance issues exist.
- Usage metric reports are available for PowerBI Pro users and can only be accessed by users with the role types of Member, Admin, or Contributor.
- To view metric usage reports, go to the pertinent Workspace. Find the report or dashboard that you want to see usage metrics for.
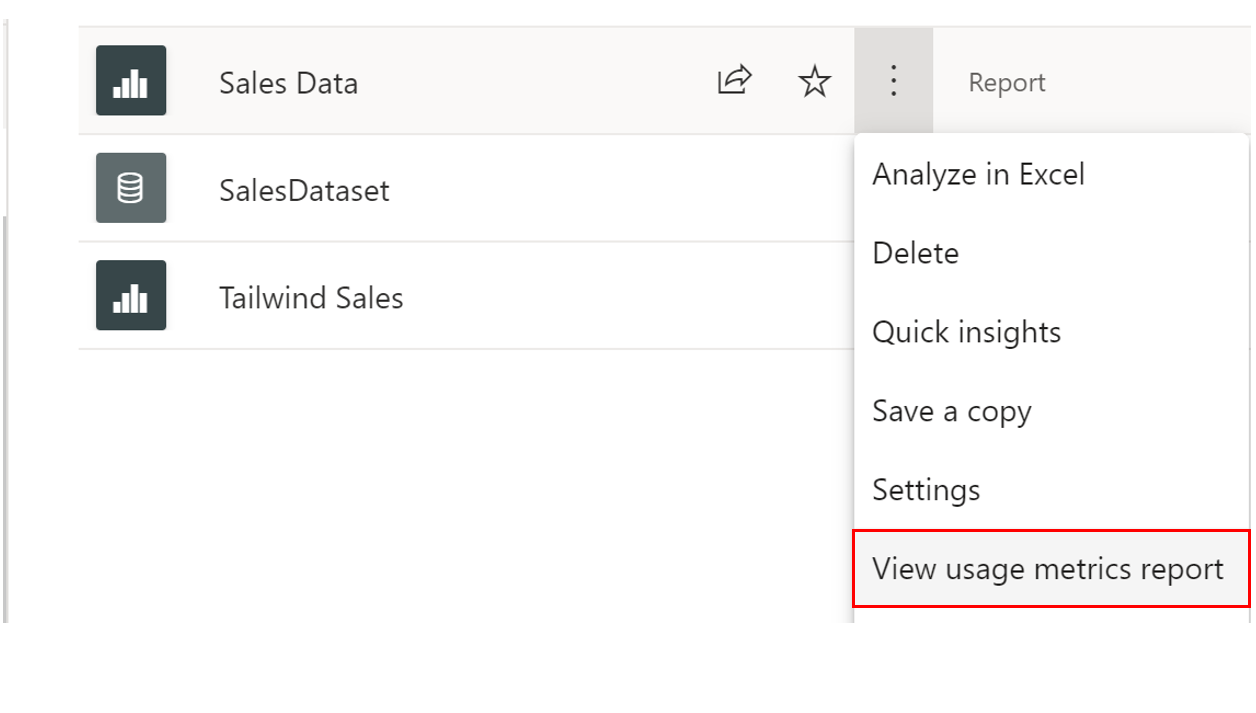
When the usage metrics report is ready for viewing, you will receive the prompt to direct you to a dashboard. In the Report usage tab, you can view such details as:
- Viewers per day, Unique viewers per day (which does not include users who returned to the same reports multiple times), and Shares per day charts
- Total Views, Total Shares, and Total Viewers KPI cards
- Total views and shares ranking -compares how your report is doing to other reports in the app.
- Views by Users (details about each specific user that viewed the dashboard)
Also Read: Our blog post on Power bi Filter.
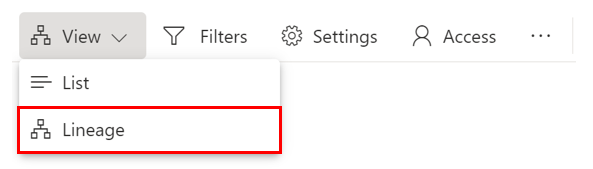
> Data Lineage
Data lineage refers to the path that data takes from the data source to the destination.
The Lineage view feature in Power BI is crucial because it:
- It simplifies the troubleshooting process because you can see the data path from source to destination and determine pain points and bottlenecks.
- Allows you to manage your workspaces and observe the impact of a single change in one dataset to reports and dashboards.
- Saves time by simplifying your task of identifying reports and dashboards that haven’t been refreshed.
The Lineage view is only accessible to Admin, Contributor, and Member roles. Additionally, it requires a Power BI Pro license and is only available for the app workspace.
When the view canvas opens, you can begin to explore this view. The following image is an example of a Data linage.

- This view shows all the artifacts in your Workspace. Artifacts include data sources, datasets and dataflows, reports, and dashboards.
- Each card represents an artifact, and the arrows in between these cards represent the flow of data or the relationship between different artifacts.
- By following the arrows from left to right, you can observe the data flow from the source to the destination, which will often be a dashboard.
Read More: About Power bi KPI.
> Configure Data Protection
Strict requirements and regulations must be applied to ensure that sensitive data is secure. Power BI provides a few different ways to help you accomplish this task:
- Use Microsoft sensitivity labels to label dashboards, reports, datasets, and dataflows by using the same taxonomy that is used to classify and protect files in Microsoft 365.
- Add more protection measures such as encryption and watermarks when you are exporting the data.
- Use Microsoft Cloud App Security to monitor and investigate activities in Power BI.
Sensitivity labels will specify which data can be exported. These labels are configured externally to PowerBI, and PowerBI allows you to use them in your dashboards and reports quickly.
- These labels allow you to protect content and define, even outside of PowerBI.
- Datasets, dataflows, reports, and dashboards can use this mechanism, and all users in your corporation can use this feature unless exceptions have been defined.
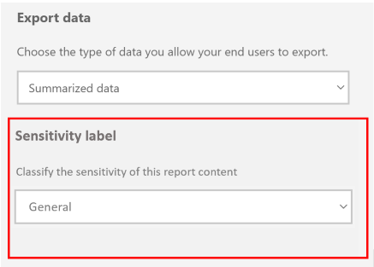

- The above image shows the example of a Sensitive label; If you want to assign a Confidential label to your Sales Data report, when you change this label on the Settings pane, it will appear as a label on the report, as shown in the above image.
Also Read: What is Power Query?
Q/A Asked During The Session
Q1. What is a Workspace?
A: A workspace is a centralized repository in which you can collaborate with colleagues and teams to create collections of reports and dashboards.
Q2. What are the Workspace roles?
A: The abilities of role types in a workspace include:
1. Admin
- remove/Add other users
- Publish, update, or/and share an app in a workspace
- Create, edit, publish and delete reports and content in a workspace
- interact and view with reports and dashboards in a workspace
- Configure data refreshes
2. Member
- Can complete all tasks that are associated with admins but can’t add or remove users
- Cannot delete the Workspace
- Cannot update the metadata about the Workspace
3. Contributor
- Cannot remove or Add users
- Cannot update, publish, or edit an app in the Workspace unless given this ability by admins/members
- Can update, create, and publish content and reports within a workspace
- Can schedule data refreshes
4. Viewer
- Cannot remove or add users
- Can only view a dashboard or report in a workspace
- Can read data that is stored in workspace dataflows
Q3. Why usage and performance in the Workspace are crucial?
A: Knowing about the usage and performance of your Workspace is crucial because it:
- Focus your efforts on improvement. If you know the areas that experience the least performance, you can concentrate your efforts for improvement in those areas.
- Quantifies the impact of your reports. Usage metrics help you determine your reports’ success.
Q4. What is the Deployment pipeline?
A: The deployment pipeline feature in Power BI manages content in dashboards, reports, and datasets between different environments in the development life cycle.
Q5. Who can access Linage view?
A: The Lineage view is only accessible to Admin, Contributor, and Member roles. Additionally, it requires a Power BI Pro license and is only available for app workspaces.
Q6. What feature in the Power BI service can you use to troubleshoot the flow of data from its source to its destination?
A: Lineage view allows you to view and troubleshoot the data flow from source to destination.
Q7. What are Sensitivity labels?
A: Sensitivity labels specify which data can be exported, and these labels allow you to define and protect content, even outside of Power BI.
Quiz Time (Sample Exam Questions)
With our Microsoft Data Analyst Associate, we cover Over 100+ Sample questions to help you prepare for the Certification [DA-100]
Check out these Questions:
B. Query Caching
C. Quick Insights
D. Linage View
Comment your answer in the comment box.
References
- Microsoft Certified Data Analyst Associate [DA100]: Everything You Need To Know
- Microsoft Certified Data Analyst Associate [DA100] Step By Step Activity Guides (Hands-On Labs)
- [DA-100 Day 1 Q/A Review] Data Analytics, Prepare Data in Power BI
- [DA-100 Day 2 Q/A Review] Clean, Transform, And Load Data In Power BI
- [DA-100 Day 3 Q/A Review] Work With Tables, Data Modeling, Data Granularity In Power BI
- [DA-100 Day 5 Q/A Review] Work With Visuals and Create Data-Driven Story In Power BI
- [DA-100 Day 6 Q/A Review] Analyze Performance, Reduce Cardinality Levels
Next Steps to begin with DA100 Certification:
Our Microsoft Data Analyst Associate Training Program will cover all the exam objectives, 11 Hands-On Labs, and practice tests if you want to begin your journey towards becoming a Microsoft Certified: Data Analyst Associate [DA-100] by checking our FREE CLASS.


![AWS DevOps [DOP-C02] Professional Step By Step Activity Guides (Hands-On Labs)](https://k21academy.com/wp-content/uploads/2023/02/DOP-C02-1.png)