
![]()
BIAs there is an exponential rise in data every day, Business Intelligence is the key factor to handle this data for organizations. This escalates the battle between MSBI vs Power BI. These are top-rated services in the Business Intelligence world today. However, both MSBI and Power BI have their own benefits and drawbacks. In this post, we will talk all about MSBI vs Power BI.
This blog will cover the following topics:
- What is Business Intelligence (BI)?
- What is MSBI?
- Features of MSBI
- Benefits of MSBI
- Drawbacks of MSBI
- What is Power BI?
- Features of Power BI
- Benefits of Power BI
- Drawbacks of Power BI
- Difference between MSBI vs Power BI
- MSBI vs Power BI: Fact-based comparison
- FAQs
- Conclusion
What is Business Intelligence (BI)?

BI stands for Business Intelligence. It is a set of processes, architectures, and technologies to analyze data and convert raw data into meaningful insights using various tools. Every other organization needs BI tools to handle and manage its data. Hence, Power BI and MSBI came into the picture. These tools help organizations to make fact-based decisions based on historical data rather than assumptions. We can create reports, dashboards, summaries, maps, and charts to understand the data.
Example: Business Intelligence helps us to make decisions to buy or sell trade in the share market using certain tools and algorithms.
What is MSBI?
MSBI stands for Microsoft Business Intelligence. It is a tool that can Extract, Transform and Load various kinds of data. We can also organize and visualize multi-dimensional data using it. Basically, it transforms the raw data into meaningful insights.
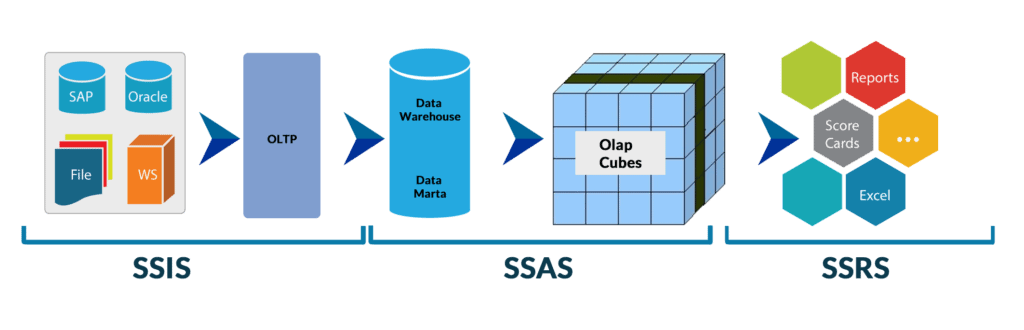
Main components of MSBI that contribute to the ETL process.
SSIS: It stands for SQL Server Integration Service. It works as a data integration service. It performs ETL operations by extracting data from different-different sources and transform it into structured form.
SSAS: It stands for SQL Server Analytics Services. It offers OLAP services where users can perform online analytic processing and helps discover data patterns.
SSRS: It stands for SQL Server Reporting Service. We can create server-based reports using it. In addition, SSRS offers to generate visuals and printed reports by accessing them through web interfaces.
Check Out: Our blog post on power bi-sync slicers.
Features of MSBI
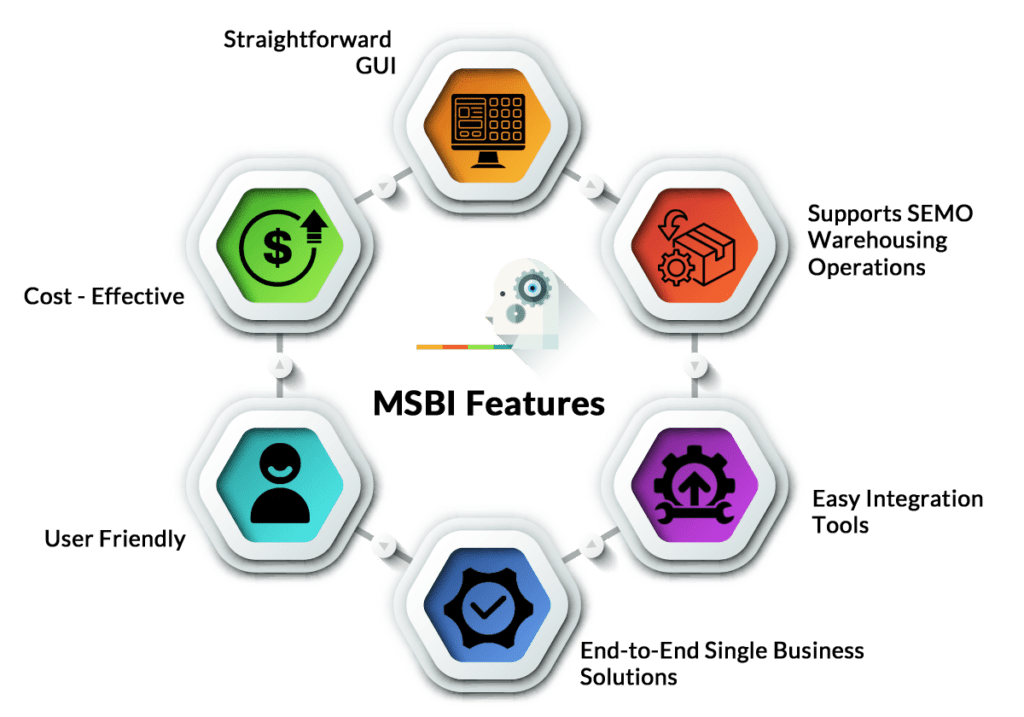
- It is a Microsoft product with easy installation and user friendly.
- It is a very cost-effective solution to create paginated reports.
- It offers end-to-end single business solutions with the support of various web services and .NET.
- It offers simple and easy integration tools with share point and .NET.
- Its GUI is straightforward to operate.
- It supports SEMO warehousing operations and multiple servers without any performance loss.
Also Check: Matrix vs Table Visualization, know their major differences!
Benefits of MSBI
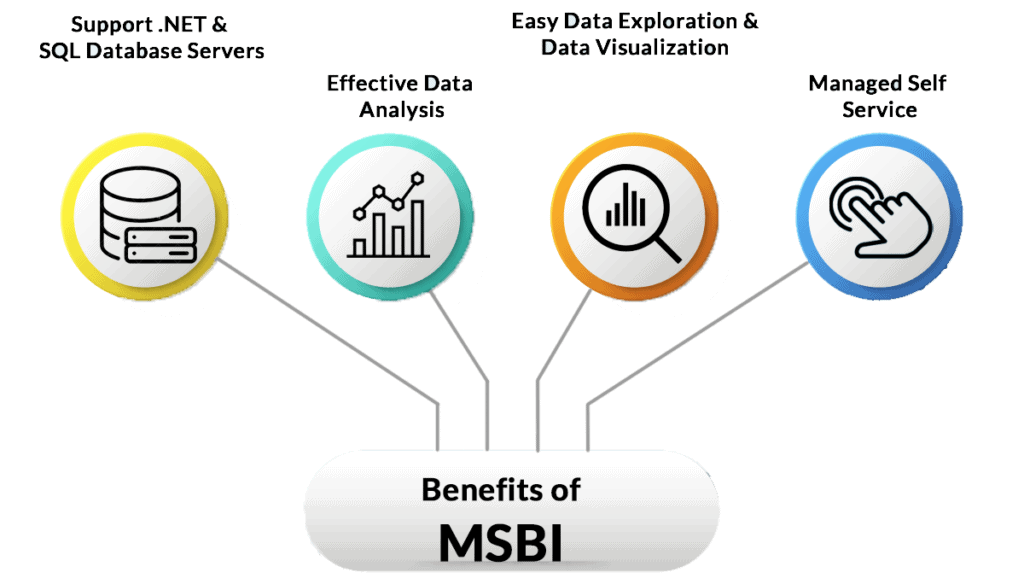
- MSBI acts as a managed self-service Business Intelligence tool. We can also use MSBI as a Microsoft Excel for daily activities and data analytics.
- It offers easy data exploration and data visualization.
- It helps to produce effective data analysis by using Microsoft Excel features to the core. In addition, its features help to collect data from various sources easily.
- It supports programming languages like .NET and SQL database servers to build web applications. In addition, it offers many other features to benefit its users.
- MSBI offers excellent analytics solutions. Users are free to collect the data warehouse from various sources.
- It offers end-to-end business solutions to make fact-based decisions.
Drawbacks of MSBI
MSBI has so many advantages, but it has some limitations too. Let’s have a look at those limitations.
- MSBI tool always creates confusion for new users due to its crowded user interface.
- It is pretty challenging to master tool concepts for new users.
- Using free versions, it offers minimal data handling.
- It has rigid formulas.
What is Power BI?

Power BI is a Business Intelligence tool developed by Microsoft. It offers various data modeling capabilities such as data discovery, data preparation, and data visualization using interactive data analytics dashboards. Power BI can pull data in multiple forms such as images, videos, excel sheets. It also helps to centralized the database management system, where users can view data models on it.
Now we will discuss the main components of Power BI.
Power BI Desktop: It is a free service offered by Power BI. It helps users to modify, visualize the data and offers complete freedom to establish a connection. Users can also create reports, visuals, and data models from multiple sources to share with other employees of their organization.
Power BI Service: This service offers to share and collaborate various data reports generated through Power BI. We can also bring all the relevant data into one place.
Power BI Mobile Apps: Power BI Mobile Apps are available for Android, Windows, and IOS devices. Users can view their reports and dashboards on mobile apps without starting the Power BI Desktop service.
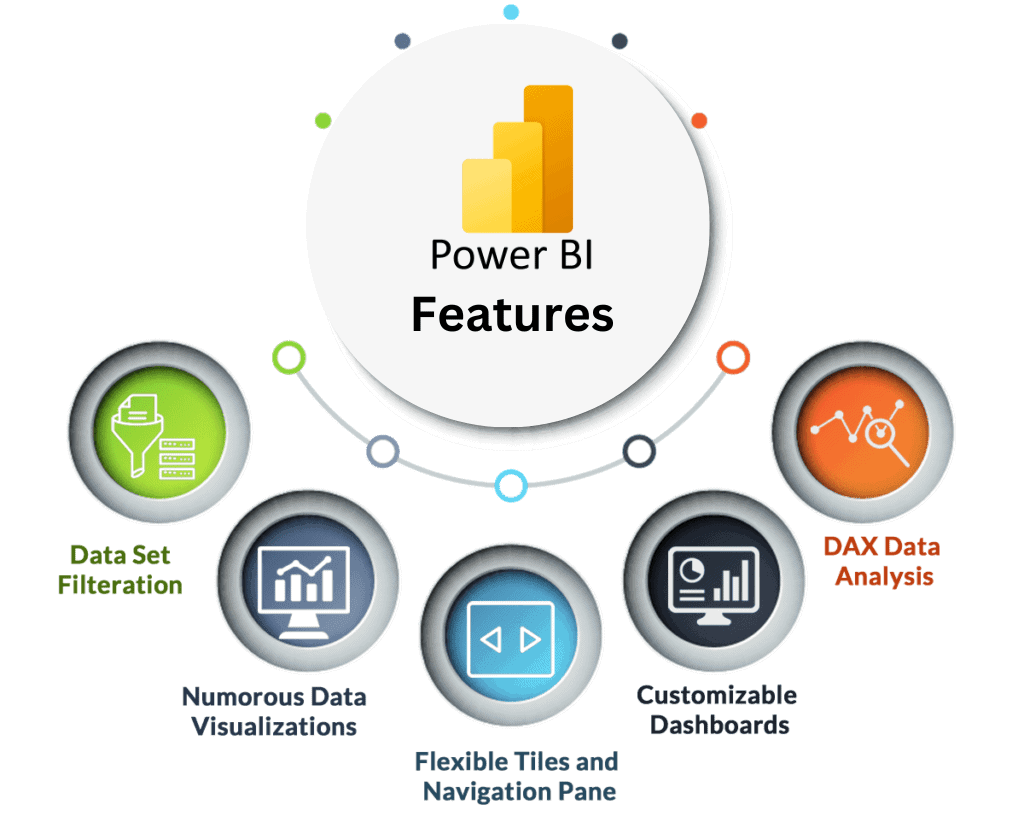
Features of Power BI
 Power BI is loaded with tons of attractive data visualizations.
 - It comes up with data set filtrations to search for any particular data.
- It has flexible tiles and a navigation pane.
- Users can easily customize their dashboards by selecting various graphical forms to represent the data.
- It also provides a Natural language Q & A question box.
- It has various other features such as DAX data analysis functions, help, and feedback buttons. Moreover, it has a rich collection of content packs.
 Power BI is loaded with tons of attractive data visualizations.
 Check out: Introduction to Microsoft Power BI platform
Benefits of Power BI
From the features of Power BI, you must have got an idea of the advantages it can offer. Let’s see the advantages of Power BI.
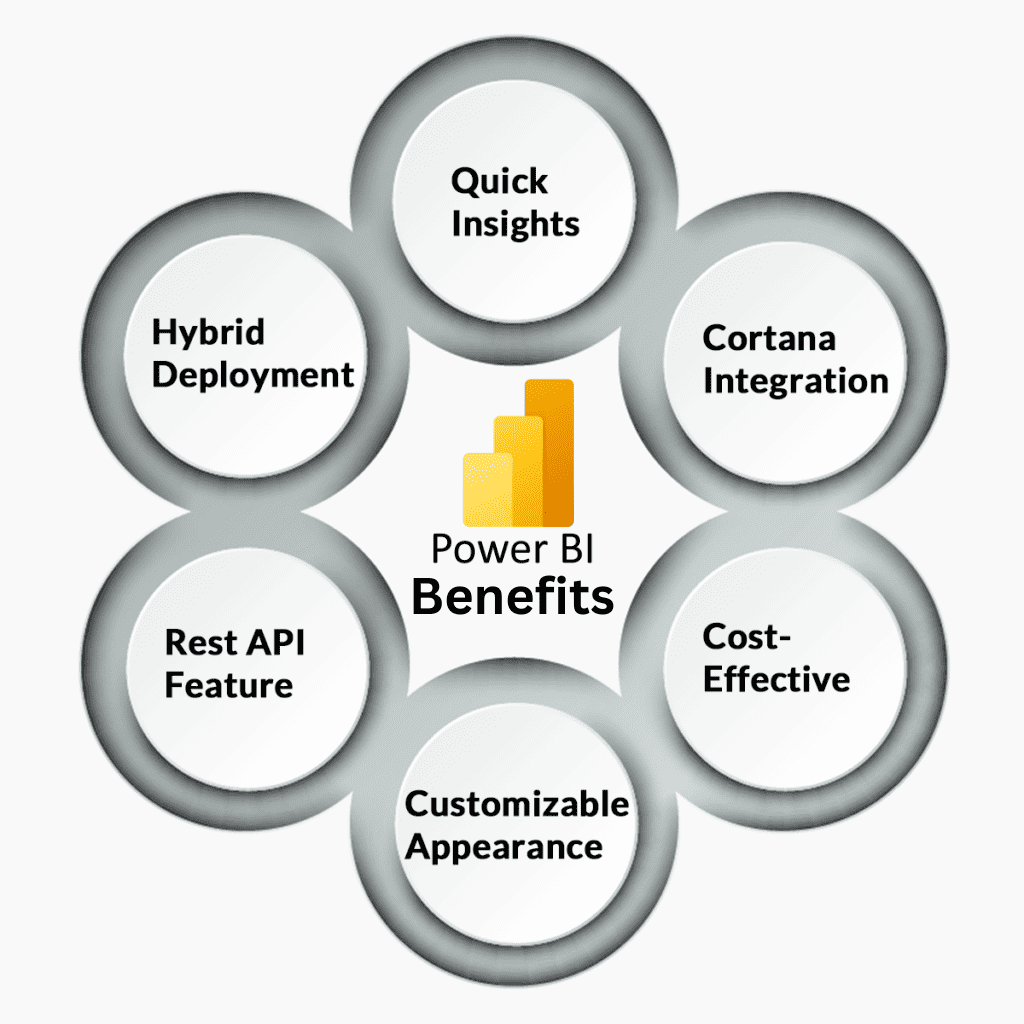
- Power BI offers hybrid deployment support, connecting with various data sources from Microsoft and other vendors.
- It provides a Quick Insights feature to create a subset of data and applies analytics to that data.
- Users can use the Cortana Integration feature to verbally query the data using Natural Language and get a result from Microsoft Assistant Cortana.
- There are several Power BI tools available for Android, Windows, and IOS.
- Users are free to customize the appearance of the default visualization.
- Power BI comes with a REST API feature that allows developers to use various resources in other software.
- Power BI is very cost-effective as the basic Power BI in Microsoft Fabric Free Account version is entirely free, and the Pro version costs around $10 per month per user.
Drawbacks of Power BI
There are a couple of drawbacks of Power BI. Let’s see them one by one.
- Power BI handles simple Table Relationships very well. But handling complex relationships in a table is quite a tough job for Power BI. Users need to create data models very carefully to create more unique fields to handle complex relationships.
- Power BI offers to perform a lot of rigid actions using DAX formulas. However, it is still not an easy language to work with. Concatenation of more than two elements requires to do nesting.
- Free subscription of Power BI offers a limited amount of data ingestion up to 2GB at once. If you want to ingest more data, you need to have paid subscription.
- Power BI is a simple tool to import and create reports from data. But Power BI is a complete package with many integrated tools, making it difficult to understand and master.
Checkout: Data modeling in Power BI
Difference between MSBI vs Power BI
Let’s find out the difference between MSBI and Power BI.
-
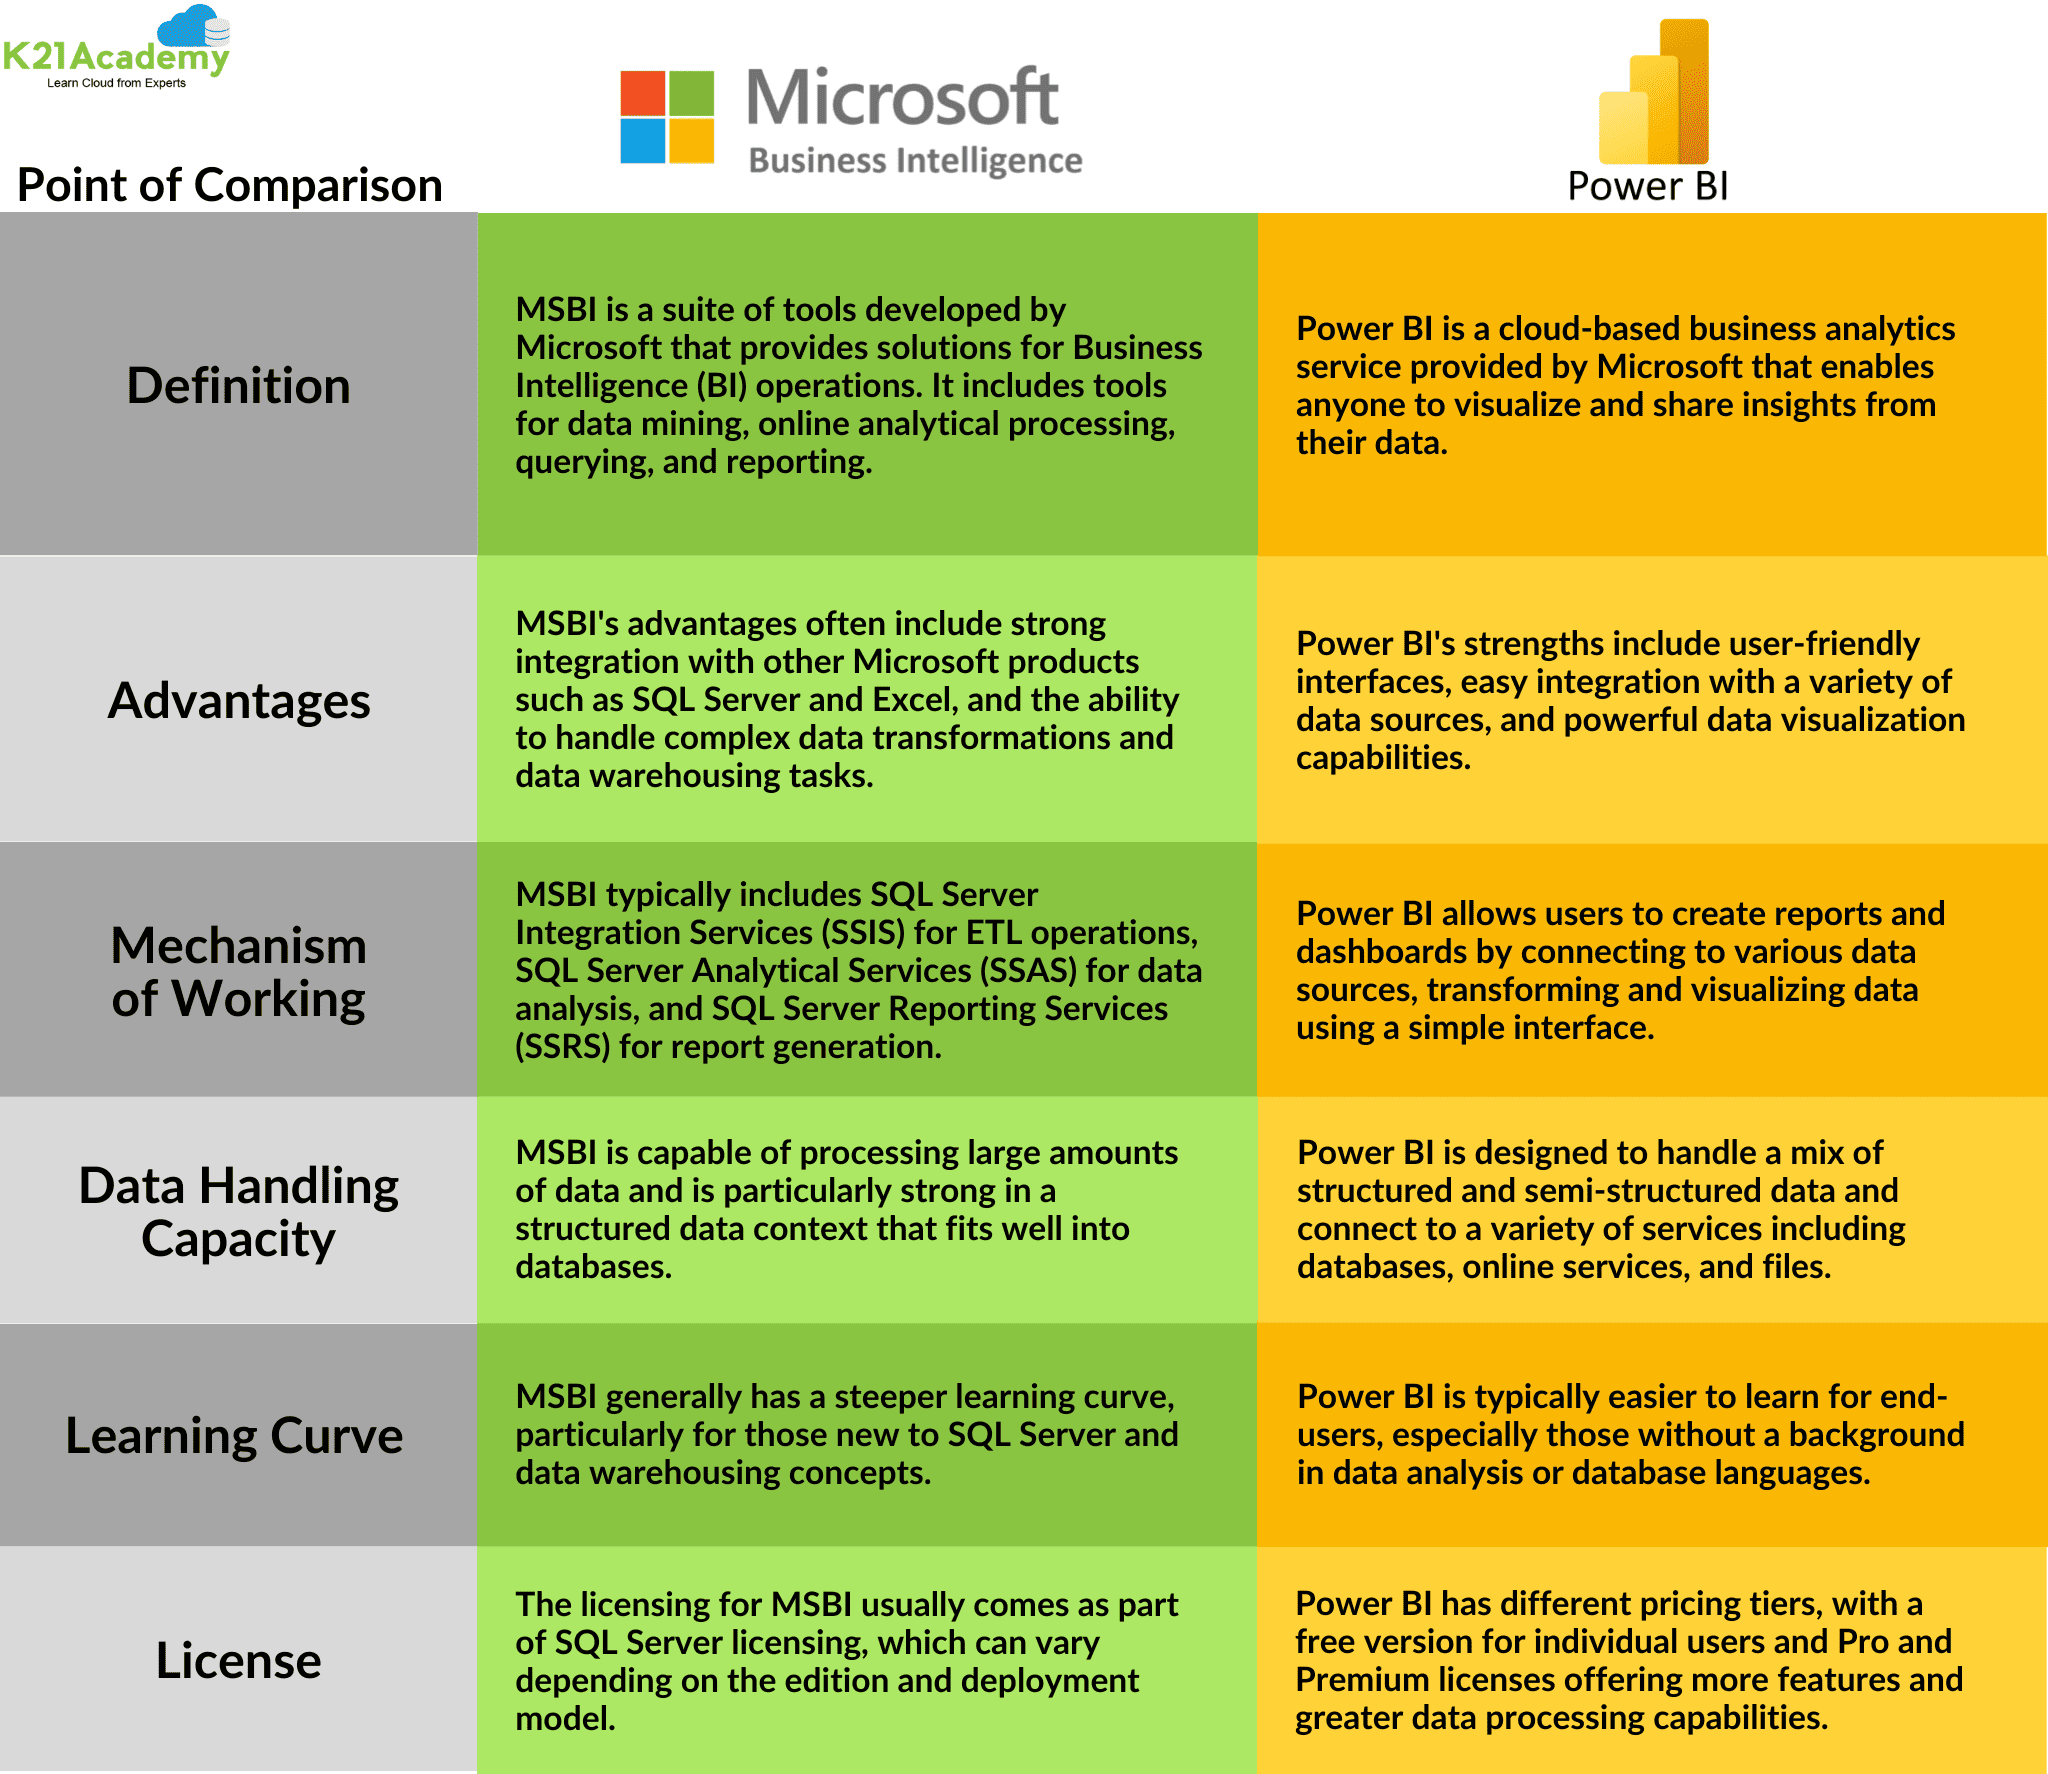
Cloud Access: Power BI offers both on-premises and cloud solutions, while MSBI is traditionally on-premises. However, some components of MSBI can be used in the cloud with certain configurations.
-
Services and Tools: Power BI is known for its simple and powerful visualization tools and is less technical, targeting business users with its user-friendly interface. On the other hand, MSBI encompasses a suite of tools, including SQL Server Reporting Services (SSRS) for report generation, which is more technical and may require programming knowledge.
-
Data Handling: Power BI has certain limitations on data volume that can be handled without performance issues. Larger datasets may require Power BI Premium or direct querying of databases. MSBI is designed to handle large volumes of data through SQL Server Integration Services (SSIS) and SQL Server Analysis Services (SSAS).
-
Report Creation: Power BI allows for easy creation of reports and dashboards, which can be shared and accessed through its apps and web browsers. MSBI, particularly through SSRS, also enables report creation, but it may require more technical know-how.
-
User Knowledge: Power BI is designed to be accessible to both technical and non-technical users, and it provides AI features that allow natural language querying. MSBI tools often require a deeper understanding of data analysis and programming.
-
Drill-Down Capabilities: Both MSBI and Power BI provide drill-down capabilities, but the image doesn’t specify this for Power BI.
Now we will see the fact-based comparison.
MSBI vs Power BI: Fact-based comparison
People always get confused to decide on what factors MSBI vs Power BI should be compared. Let’s have a look at those factors to solve this confusion.
Note: Prices listed above are for basic plans. There are other plans available as well.
FAQs
Q1. Is Power BI better than SSRS?
Ans: Power BI comes up with graphical components to represent data in a visualized way whereas nothing like this is supported in SSRS. In SSRS, users need to make reports manually. Therefore SSRS is preferred for generating and publishing reports whereas Power BI is used for visual reports and dashboards. Hence, Power BI is slightly more preferable to SSRS
Q2. What is meant by MSBI?
Ans: MSBI stands for Microsoft Business Intelligence. It is a powerful tool to provide the best and most optimized business intelligence solutions. It consists of various tools to find solutions for data mining as well.
Q3. Is MSBI an ETL tool?
Ans: MSBI consists of various tools that help to provide optimized solutions for Business Intelligence and data mining queries. There are mainly three tools for ETL, Reporting, and Analysis in MSBI.
4. What is SSRS, SSIS, SSAS?
Ans: SSAS stands for Microsoft SQL Server’s Analysis Services that are used for OLAP processing, reporting, and data mining whereas SSIS stands for SQL Server Integration Services and SSRS stands for SQL Server Reporting Services.
Q5. Is Microsoft Power BI free?
Ans: You can download the Power BI Desktop Application for free and create data models, reports, and dashboards for free. But, If you want to access Power BI in the cloud, you need either a free or pro license.
Conclusion
Business Intelligence tools keep track of current market trends. MSBI and Power BI tools offer to create interactive data insights and protect data. These two tools are widely used by IT professionals, business analytics, data analysts, and even the heads of companies to grow their business exponentially. MSBI occupied the offices for a long time, but now Power BI has outshone its presence. MSBI is a good, cost-effective solution when organizations use paginated reports on-premises.
On the other hand, Power BI offers interactive data visualizations from complex data. Moreover, power BI reports are dynamic and easy to understand in graphical form. Hence, we can conclude that Power BI is a slightly preferable tool over MSBI.
References
- Introduction to Microsoft Power BI Platform | Everything You Must Know
- Exam PL-300: Microsoft Power BI Data Analyst | A Replacement Of DA-100
- Microsoft Certified Data Analyst Associate [PL-300] Step By Step Activity Guides (Hands-On Labs)
- Case Study: Display Live Data Streaming Using Power BI Service
- Introduction to Data Modeling in Power BI
- What is Power Query | Microsoft Azure Power BI Tool
- Top 15 Differences Between SSRS vs Power BI
- How to Become a Power BI Developer?
Next Steps to Begin with PL-300 Certification:
In our PL-300 Certification Training Program, we’ll cover 10+ Hands-On Labs. If you wish to start your journey towards becoming a Microsoft Certified: Power BI Data Analyst Associate, try our FREE CLASS.


![AWS DevOps [DOP-C02] Professional Step By Step Activity Guides (Hands-On Labs)](https://k21academy.com/wp-content/uploads/2023/02/DOP-C02-1.png)