


![]()
If you’re looking for one of the best Business intelligence reporting and visualization tools used currently in the market, this blog is the right place to get acquainted with! We are going to look at all the what’s and why’s of Microsoft Power BI and how flexible of a BI tool is it to help you get started with your business reports and visualizations.
We are going to cover the following topics about Power BI:
- What is Microsoft Power BI Platform?
- Why choose Power BI?
- Advantages of Power BI
- Types of Power BI Services
- Power BI Visualization Elements
- Other Power BI Terminologies
- A Career in Power BI
- References
- Next Task For You
What is Microsoft Power BI Platform?
Microsoft Power BI is a handy and one-stop-solution tool in every Data Analyst or Business Intelligence practitioner’s toolkit. In today’s time, businesses are expanding and thriving on how well are they understanding and making use of their data. According to the below definition of Power BI, we understand the major purpose of Power BI:
“The Power BI Platform is a Microsoft cloud solution packed with various software services, connectors and apps that help to consolidate and ingest data from multiple unrelated sources, perform various pre-processing, transformations and shaping of data and finally utilize them to deliver complicated and compelling visualizations or useful reports.”
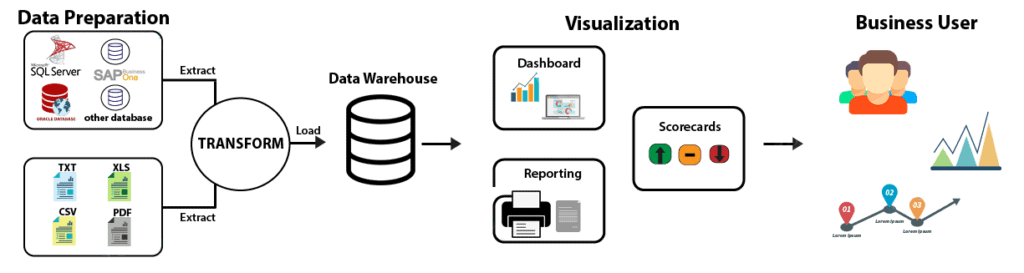
This definition of Power BI above indicates that it is also beneficial for roles such as Functional Consultants, Managers, Developers, App Makers, Business Owners and Data Scientists too. In general, it is helpful for anyone trying to understand, measure or track their business data, metrics, or parameters in a user-friendly way.
Why choose Power BI?
Microsoft Power BI is one of the commonly used and trusted data visualization and manipulation tools in spite of many other successful tools in the market today. Here are some of the reasons why is it still a preferred visualization tool for businesses:
- Power BI feature provides a strong backend data joining and manipulation service and is very closely integrated with the commonly used Office 365.
- It can be connected with Sharepoint. Since it is a Microsoft Service, it can well blend, interact and connect to other Azure Services and components.
- Power BI is much cheaper compared to other visualization tools.
- It can use cloud storage and is easy to implement.
- Power BI offers DAX (Data Analysis Expressions) as its formula expression language which is commonly known by Data Analysts and BI users. Thus, it provides excellent data manipulations (both built-in and user-defined).
Advantages of Power BI
Power BI has many advantages for its users and organizations:
- Supports many data sources: Power BI provides the flexibility to connect and ingest data from a vast number and variety of data sources. These data sources may be cloud services, different file extensions, company databases, online services and many more. It can import huge data from these sources regardless of their structure.
- Large data handling capabilities: Power BI is known to have hundreds of methods of transforming the data. It can perform aggregations, slicing-dicing and also custom transformations to clean and shape messy data.
- Similarity with Excel: Apart from connecting to Excel data, Power BI has few features which are also in Excel. This makes it easy for Excel users to easily shift to Power BI and get started with their dashboards quickly. Power BI consists of Power Query which is used for connecting to vast data sources, reshape data and publish it as datasets using the M Language. It also supports Power Pivot with the powerful DAX language, which is used to build data models and cubes, derive new columns from existing ones and calculate business measures and KPIs.
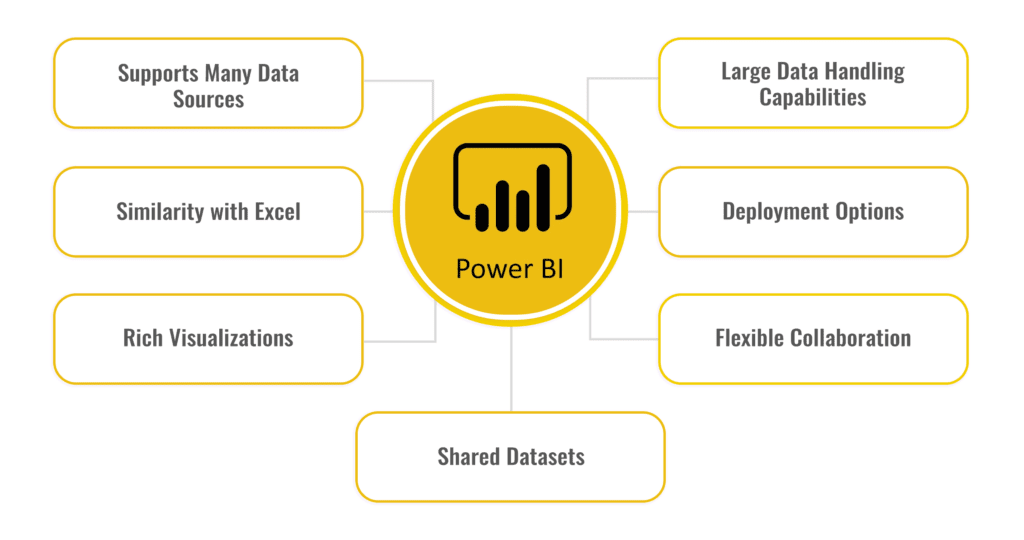
- Deployment Options: Power BI dashboards or data apps can be deployed in many devices such as the web, handheld devices (mobiles, laptops, tablets) using various access levels. This helps organizations to let their end users consume their content according to their policies and user privileges.
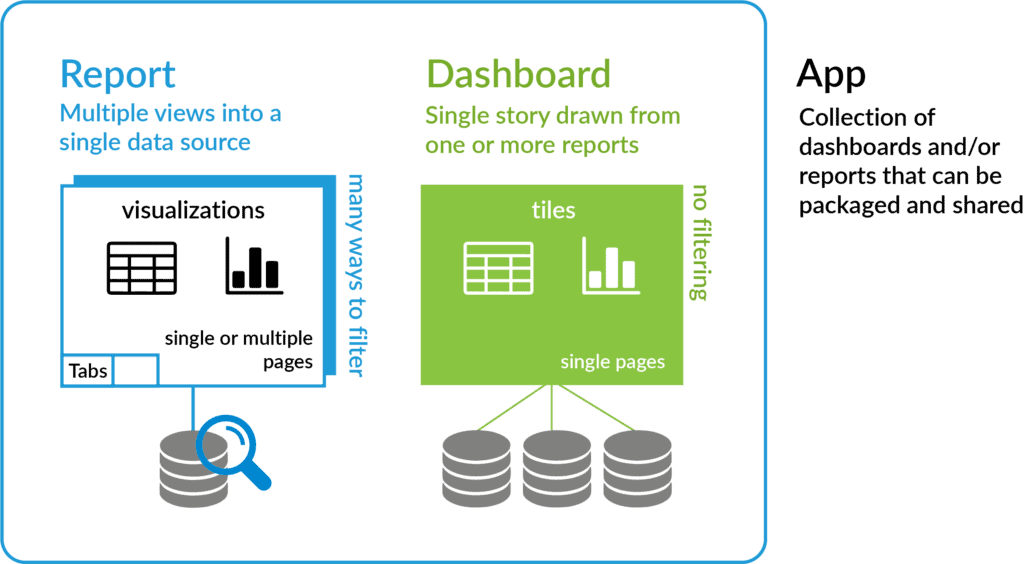
- Rich Visualizations: Power BI provides its users plenty of immersive visualizations. These visuals are interactive to the end-user and can be filtered according to any criteria. We can also drill up or drill down to the lowest granularity for more insights. Reports are individual entities of charts, while a dashboard can contain multiple reports tied together. An app is regarded as a collection of reports as well as dashboards.
- Flexible Collaboration: Power BI Subscriptions offer various modes for a content owner to invite other creators to collaborate in making dashboards in a secure and single platform. Resources can be shared across Workspaces and Capacities, each having its own principles and sharing features according to the owner’s subscription. Each user has its own My Workspace, to create reports/dashboards and let others view them.
- Shared Datasets: Power BI partners and other trusted organizations can publish their cleaned, transformed, and verified datasets after ingesting and shaping them with Power BI. This acts as a trusted source of data with which other designers can get started away easily for their content. If the source data is updated, it updates the dashboards and apps of the designers connected to and using those datasets
Types of Power BI Services
To meet each of its customers’ role and comfort in creating, consuming and sharing business insights, reports, or visualizations, Microsoft delivers its Power BI Platform in 3 forms of services:
- Power BI Desktop: Microsoft Windows application for desktop users. You can install the application from the official site and start using Power BI Desktop on your local machine.
- Power BI Web App (Power BI Service): It is an online SaaS ( Software as a Solution ) Service also which can be accessed via any browser. It provides the same environment and feel like the Power BI Desktop, which an advantage that you can access and use in the browser itself without downloading it.
- Mobile Power BI: Available for tablets and mobile phones.
Power BI Visualization Elements
These are the basic elements that arrange or group Power BI visualizations together:
- Datasets: It refers to the data collection that you import or connect to in Power BI to get started with. Power BI supports a variety of data sources, a few of which are listed below:
- Files: Excel, Text/CSV, XML and JSON
- Databases: Oracle, MySQL and PostgreSQL databases, SAP HANA, Snowflake and Amazon Redshift
- Azure: Azure database and storage services
- Online Services: Google Analytics and Facebook
- Other: R Script and Hadoop HDFS File
- Shared Datasets: These are standardized, trusted and optimized datasets in Power BI shared by some data experts within an organization so that other report makers or dataset consumers can connect to them for their purpose for a healthy data culture and ethic. If that source dataset is refreshed or altered, it affects all those reports which have connected to that shared dataset.
- Reports: A report in Power BI is either a single data visualization or multiple pages of visualizations, that portray the hidden insights or metrics from the underlying dataset. Reports are formed from the same data source, can be drilled down and filtered to get varied and narrow information.
- Dashboards (only for Power BI Service/web app): They are a collection of multiple tiles, reports, or widgets. They are used for a high-level overview of data (business insights, metric behavior).

- Tiles (only for Power BI Service/web app): They can be imagined as a single piece of data visualization on your data dashboard. It can be created from datasets, dashboards, reports and other data sources too.
- Apps: Apps are used by Power BI or general BI Designers to share their content on the App Service. They are a collection of dashboards and reports related to each other in purpose or theme. Though they are interactive, end users cannot edit them.
- Template Apps: They are ready-made templates or designs of Power BI apps that users with little to no coding experience can use on the fly and connect their data sources to get started quickly. Template Apps can be created and submitted by anyone to the Power BI Partner. They become publicly available in the Power BI Apps marketplace and on Microsoft AppSource.
Other Power BI Terminologies
- Capacities: It is a concept of access management of a collection of Power BI resources such as Reports, dashboards that are meant especially for personal or public use. You can think of a capacity as a virtual container of resources such as storage, memory, workspaces containing your content. This ‘container’ or capacity can be accessed by either a particular organization/user or by a group of organizations/users. There are 2 types of capacities in Power BI:
- Shared Capacities can be shared with multiple Microsoft Consumers or organizations. Each organization has its own resources which are not conflicted with another’s resources. By default, workspaces are created on a shared capacity since in general, we design reports to be shared amongst multiple end-users.
- Dedicated or Premium Capacities are resources meant for a single consumer only. However, these need a Power BI License to get started with.
- Power BI Licenses: Power BI provides different licenses that organizations and end-users can use to facilitate various features and privileges. The type of license that you or your organization need depend upon various factors like the type of content (public or private) that you want to share across the type of consumers (internal or public) using various sharing features. There are 3 Power BI Licenses:
- Free License: In this license version, users ( also referred to as free users ) can access Power BI features to create dashboards and connect to data ONLY in their My Workspace area.
- Pro License: This license allows Pro users to share their created content within a ‘Shared Capacity’ with other Pro users only, to collaborate. They can access workspaces outside their My Workspace area (discussed below). They can let free users consume their content if it is hosted on a ‘Dedicated or Premium Capacity’.
- Premium Per User ( or simply ‘Premium’) License: A designer with this license can share their reports, dashboards within a ‘Shared Capacity’ with other Premium users only for collaboration. They can also access workspaces outside their My Workspace area (discussed below). But if their content is hosted on a ‘Dedicated or Premium Capacity’, the Premium users will be able to share it with free users as well as Pro users too.
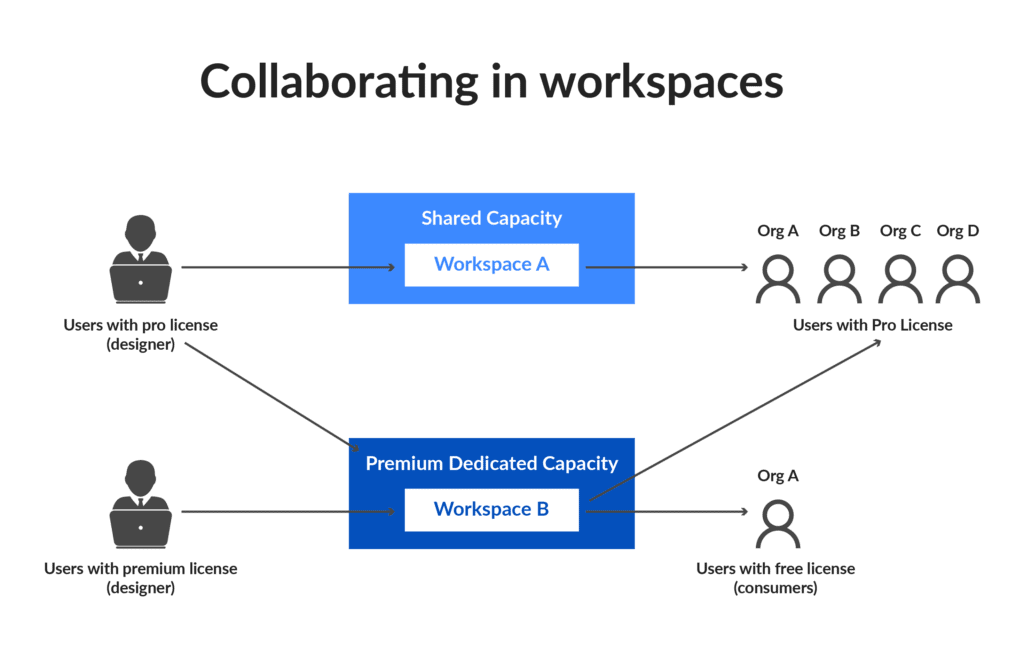
- Workspaces: They are containers or staging areas to work with Power BI reports, dashboards, dataflows, or apps. They can be reserved for personal usage only or for collaborative/team usage. There are 2 types of Workspaces:
- My Workspace: It is meant for you to work on your own personal Power BI content. Only you have access to the content created here. You can share your dashboards, reports or any other content with other users though.
- Shared Workspace: This is meant for collaboration among designers in a team to work together. You can add multiple users into your shared workspace and together you can create and manage the content. For this purpose, all workspace members need Power BI Pro licenses.
A Career in Power BI
Power BI is a leading tool in the market for some of the data-oriented career roles such as Data Science, Data Analyst and Business Intelligence. Its flexibility to use, the ability of complex data manipulation and analysis and creativity of visualization content have made it one of the high-paying career choices for BI users and designers.
Power BI is used in many market sectors such as Software and Information technology, Healthcare and Finance and functional areas where reporting and analysis of data is done at a frequent level.
Its functionality easy for beginners to get started with and is a good choice for other experienced professionals aiming for a data-oriented career due to its market legacy.

Some of the niche (role-specific) career opportunities for Power BI are:
- Power BI Data Analyst
- Power BI Developer
- Power BI Software Engineer
- Senior Software Engineer
- Power BI Analyst
- Power BI Business Analyst (IT)
- Senior Business Intelligence (BI) Analyst
Microsoft provides a related and useful certification called the Microsoft Certified Power BI Data Analyst Associate [PL-300] which assesses your Power BI skills. This certification is very useful to showcase in your bundle of skills as a Data Analyst or a BI Practioner in using Power BI to ingest, model, and make data reports or dashboards.
References
- Exam PL-300: Microsoft Power BI Data Analyst | A Replacement Of DA-100
- Microsoft Power BI Data Analyst Associate [PL-300] Step By Step Activity Guides (Hands-On Labs)
Next Steps to begin with PL-300 Certification:
In our PL-300 Certification Training Program, we’ll cover 10+ Hands-On Labs. If you wish to start your journey towards becoming a Microsoft Certified: Power BI Data Analyst Associate, try our FREE CLASS.


![AWS DevOps [DOP-C02] Professional Step By Step Activity Guides (Hands-On Labs)](https://k21academy.com/wp-content/uploads/2023/02/DOP-C02-1.png)