


![]()
Data generated by businesses and companies are huge. Also, the company will analyze its data in deep to turn them into valuable insights. The data to be analyzed can be highly confidential too. Thus, a company will not compromise security in any way. Let’s see how we can implement and configure data security in Power BI. This blog will cover the following topics.
- Overview Of Power BI
- Why Security In Power BI?
- What Is Row-level Security?
- Using Row-Level Security In Power BI
- Conclusion
Overview Of Power BI
Power BI is a business intelligence tool to effectively analyze and visualize your data. Power BI is owned by the leading tech giant and cloud service provider Microsoft. Power BI is much similar to Excel but provides more features. Dashboard with Reports and Visualization is one of the key features that make Power BI a better choice than Excel. Power BI can be used in computers, mobile devices and browser as well. Most of the companies in the market today opt for Power BI for their business analytics requirement. With this much use and demand, data security in Power BI is crucial.
Why Security In Power BI?
To analyze and create reports, data is loaded in Power BI. You may need to work around a huge amount of data that can be confidential for your company. In any case, the company will not want to hand over its data to a person who is not trustable. So, it is important to divide your data into different roles and groups. Each role area must be restricted with specific access limits. Dashboard data and reports in Power BI can be restricted depending on the roles you create. Based on the restrictions, an employee will get limited access that is needed for them to work. Some frequently used methods for data security in Power BI are:
- Sensitivity Labels – This is only available for premium Power BI users. Using this, the owner can apply labels on the reports that define the sensitivity of the reports. For example, a company can mention a highly confidential label with its name on the data and reports.
- Row Level Security – All Power BI users can use this security method. Using this method, a user can be restricted to access data based on the roles defined by the owners.
What Is Row Level Security?
Row Level security helps secure the data present in tables based on filters applied on single or multiple rows. You can use Row-level security in Power BI to restrict data access. Data will be restricted based on the roles which you create for a profile or group of persons. For Example, a company wants to only share the revenue records with its trusted persons, and all other employees will not see those details. This level of controlled access supports revenue enablement by ensuring that sales, marketing, and leadership teams have access to the data they need while protecting sensitive financial information from unauthorized users. Then you can create some roles based on employee needs to a Power BI report.
Check Out: Our previous blog post on Paginated Reports Power Bi. Click here
Using Row Level Security In Power BI
To implement Row Level Security in Power BI, we will use a shop record containing customers, products, sales, and country-based revenue. Our motive will be to create some roles in Power BI to restrict access to the revenue records. If you are new to Power BI, please check our previous blog on Data Modeling in Power BI before implementing data security in Power BI. It will help you to learn the various tricks for data import and management.
You can download our sample data from here.
Create And Manage Roles
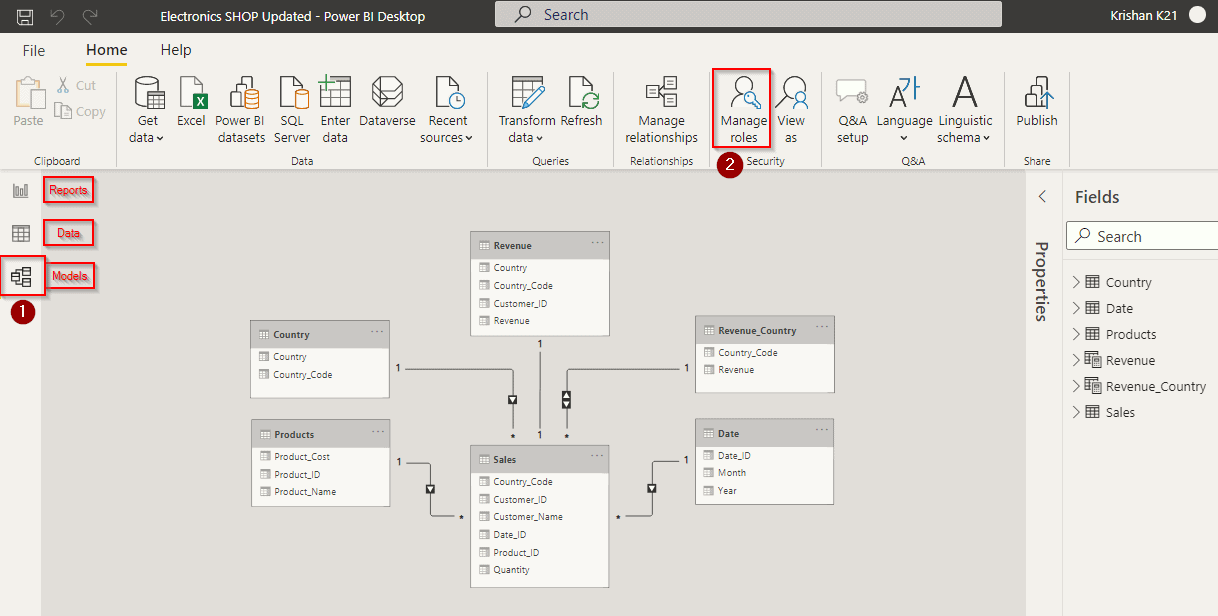
First of all, to create and manage roles in Power BI, visit the ‘Models‘ tab as highlighted in the image. Here Power BI will automatically show your data models with default relations created by Power BI. Next, you need to click on ‘Manage Roles‘ to start creating roles in Power BI. Then, click on the button ‘Create’ on the next screen.
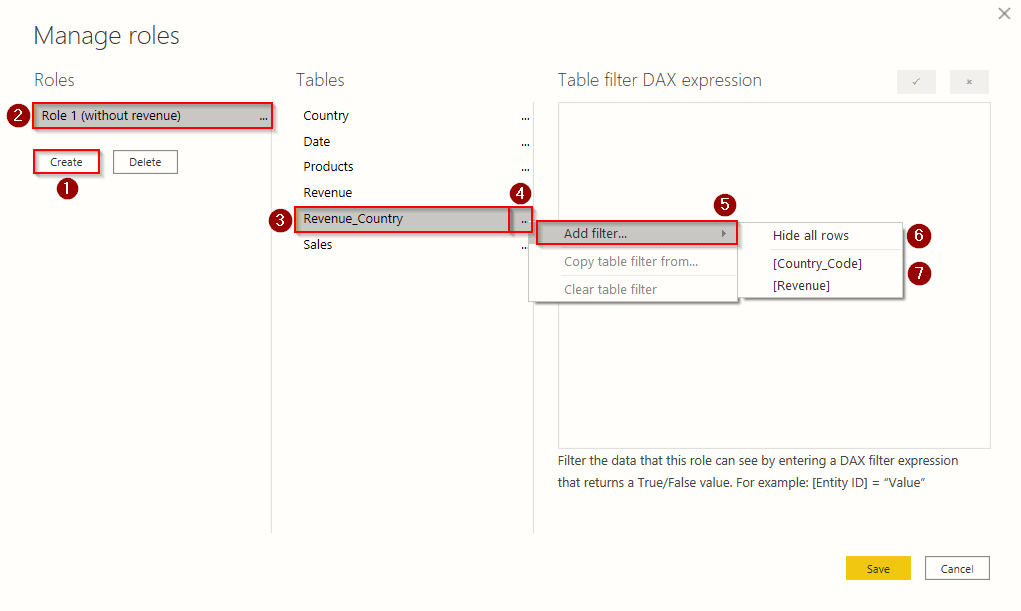
- The ‘Create‘ button lets you create multiple roles. When you are done applying all the filters to a role, you can click on this button to create the next role. If you ever change your mind, the ‘Delete’ button will delete the current role next to it.
- Whatever name you want to give to your role will be assigned here by double-clicking on it, as shown in the above image.
- Click on the table name that you want to filter in the created role. Here is the same table where our data is present that we want to hide for this role.
- Click on the ‘3 dots menu‘ present at the end of the table name to open the options window.
- Here, you can see some options provided by Power BI. Click on ‘Add Filter‘ to add a filter on the table for this role. Other options present here will help you copy the already created filter from another table and clear the current filter.
- This is the ‘Hide all rows’ filter to hide all the rows present in the selected table. This option will work for all the tables where a similar kind of data is present. Click on this to create our first role that doesn’t have the right to see any revenue details in the table.
- These are all columns present in a selected table. We will use these filters in our upcoming roles below.
You can check the statement below the DAX filters window that explains the working of DAX expression here as filters. A column name or ‘Entity ID’ is compared with the value present in a column for quality. If the condition meets the statement results true and else false. Based on these results, data is shown or hide in a table for the specific roles. We will be creating 3 different roles to make you more familiar with DAX expression as filters.
Role 1 – To hide all the rows.
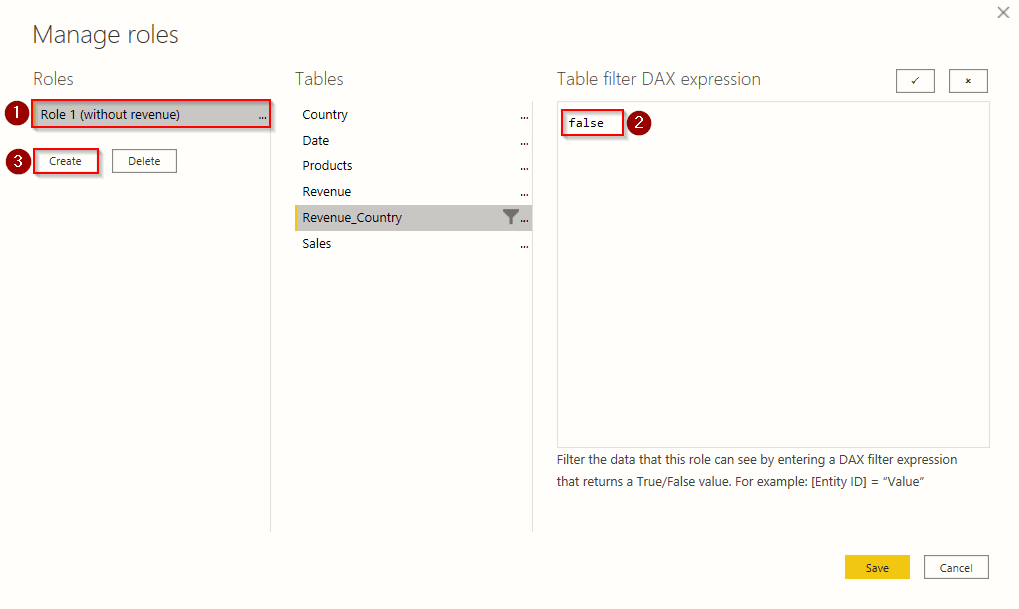
After clicking on the ‘Hide all rows’ button, Power BI will automatically generate a DAX (Data Analysis Expression) to say ‘false’ automatically. This will restrict the users to see the revenue from all the tables. So for Role 1, we have filled the name and added the filter. Now click on Create as highlighted in the image below to create other roles.
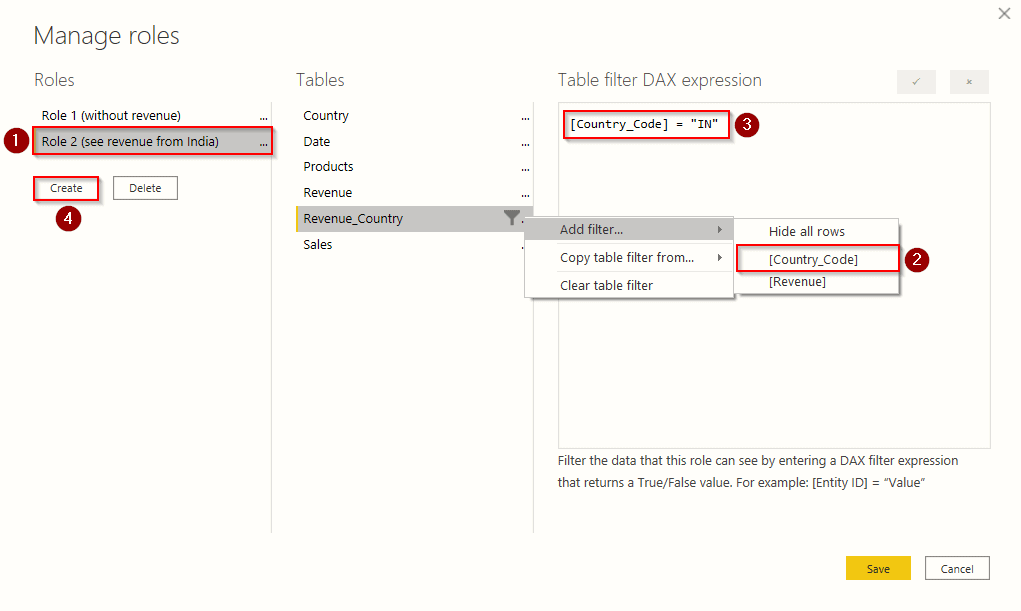
Role 2 – To view only a specific row.
This role will only provide access to see a specific row in a table. After assigning the name to our roles, we selected ‘Country Code‘ as our filter that equals ‘IN‘.
In this column, multiple country codes are present and next to it is the revenue. So we want to hide all countries revenue except the country that we have mentioned in our case, as shown in the image below. Users of this role will not be available to see anything except the revenue of Country India.
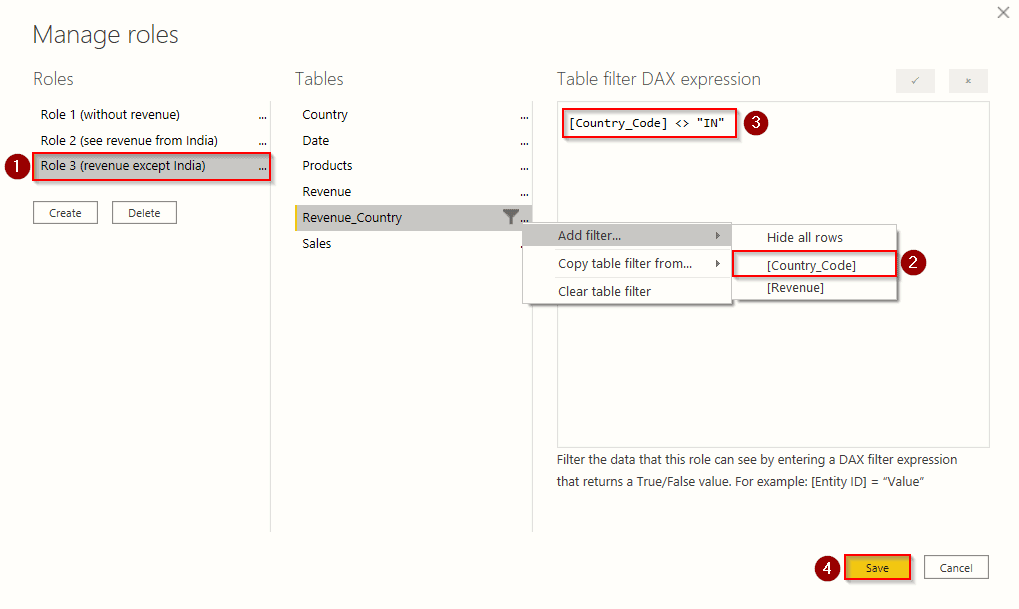
Role 3 – To hide a specific row.
We will hide a specific row in this role. Suppose we want to hide the country India and its revenue from users of this role. Then we will click select ‘Country Code‘ as our filter and ‘IN‘ as value. Here comparator operator (<>) signifies the ‘not equals to’ relation between two values in a DAX expression. So, for value ‘IN’, the false will be returned by DAX expression that will hide every row that contains ‘IN’ in its value. When all your roles are properly set, click on the ‘Save‘ button highlighted in the image below.
Check Out: Microsoft Power bi vs Tableau, know their major differences!
View And Verify Roles
Power BI allows to check and confirm all the roles that are created. These will be helpful, especially when you are not aware of the filters and DAX expressions. We will check all the roles one by one that is created above.
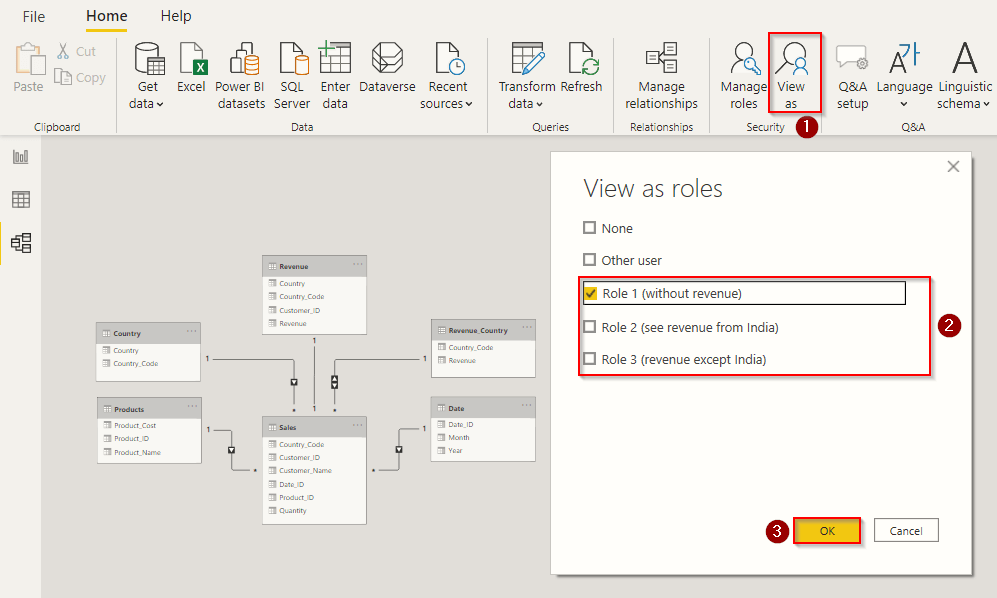
To see the roles you have created, visit the ‘Models‘ tab and click on the ‘View as‘ menu, as shown in the image below. Now select the role that you want to see and press the button ‘OK‘. We chose our first role that is ‘Role 1 (without revenue)‘.
Role 1 – To hide all the rows.
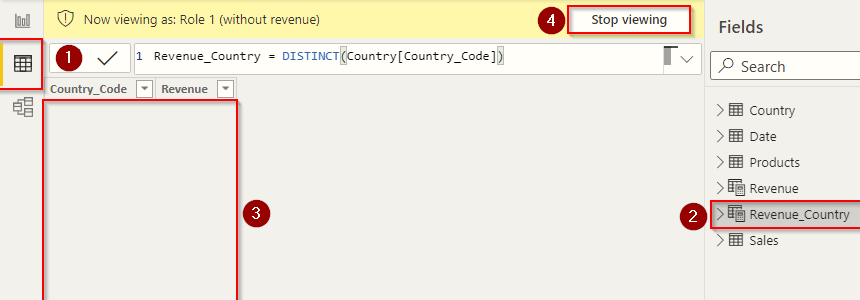
- Visit the’ Data’ tab to see the visible data for this role, as shown in the image above.
- Visit the table for which you have added filters on the role. For our case, it is ‘Country Revenue‘.
- Check your tables, the data that is not visible. We selected the ‘Hide all rows’ filter for this role, and yes, it worked as it was supposed to do.
- Now click on the ‘Stop Viewing‘ button to check other roles.
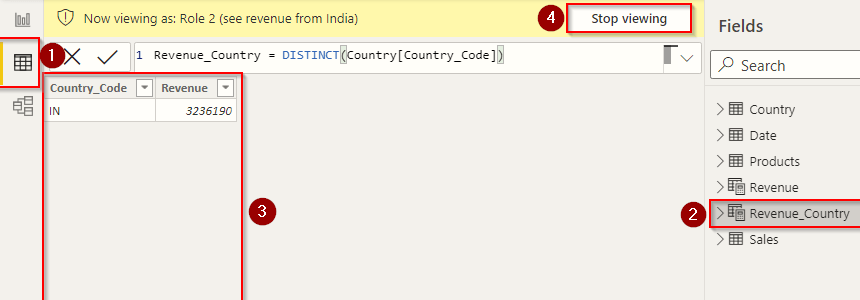
Role 2 – To view only a specific row.
Again click on the ‘View as‘ menu and select the next role.
- To see the data, visit the ‘Data‘ tab as shown in the image above.
- Select the table for which you have added filters on this role. For our case, it is ‘Country Revenue‘.
- For this role, we passed the DAX expression on our filters as [Country_Code] = “IN”. This expression hid all the rows except ‘IN’. This expression is useful when you want to deploy only sufficient data for a user or employee.
- Click on the ‘Stop Viewing‘ button to check our last role.
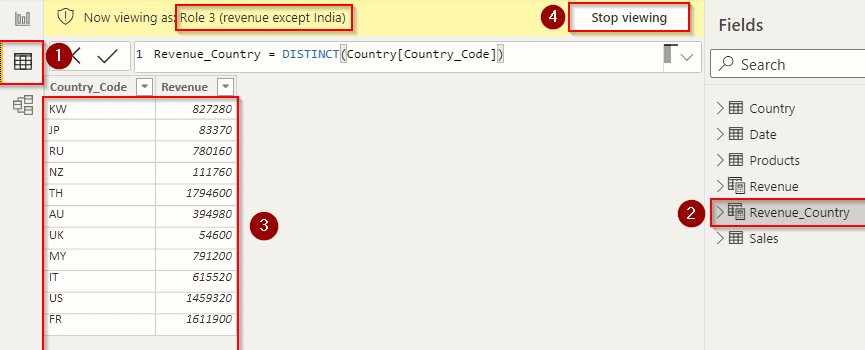
Role 3 – To hide a specific row.
Repeat the process and click on the ‘View as‘ menu. Then, select the next role.
- Remember to visit the ‘Data‘ tab.
- Cross-check the table for which you have added filters on this role.
- For this role, we passed the DAX expression as [Country_Code] <> “IN”. This expression hides the rows containing ‘IN’. This can help to hide some specific values from our data.
- Finally, click on the ‘Stop Viewing‘ button.
Read More: About Azure Power bi. Click here
Publish To Power BI
You have created roles in Power BI, and now a question arises to add members in a role. Unfortunately, you can’t add members using the Power BI desktop. To add members to the role, you need to visit the Power BI online service using your account. Now visit Power BI online site or click here. Sign in using the same account that you used on the Power BI desktop.
- If you haven’t signed up, click this area and signup using your corporate email address. If you don’t have a corporate email address, create one free onmicrosoft.com email by visiting the Microsoft Azure portal.
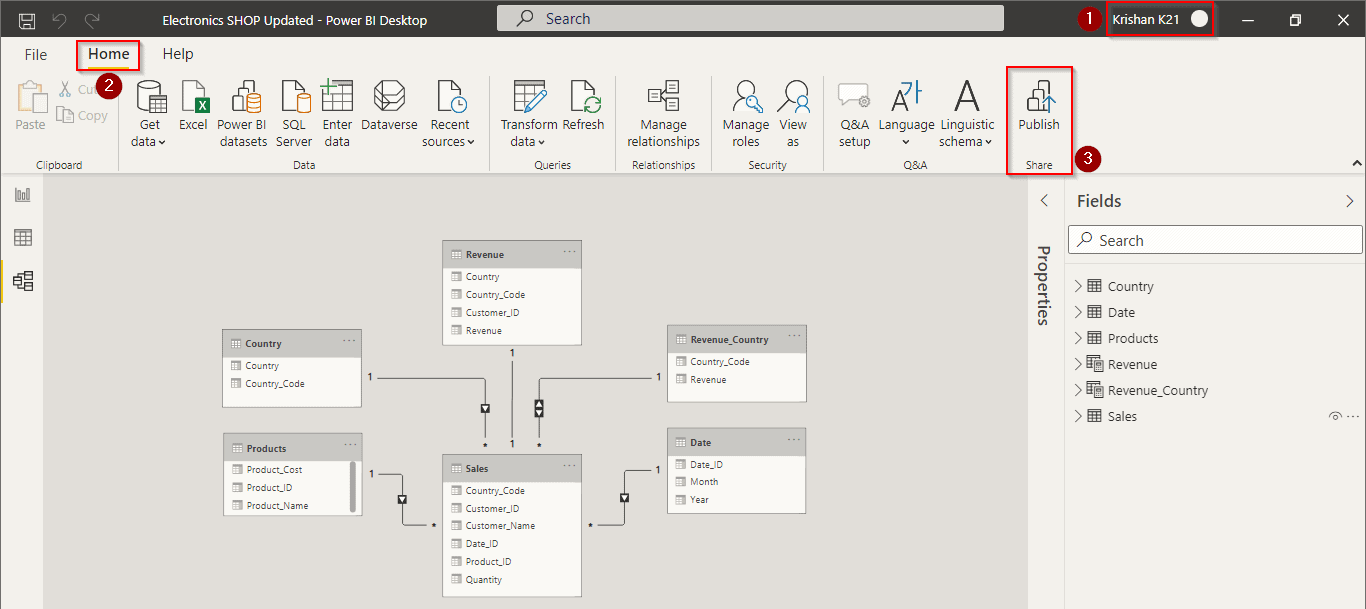
- Visit ‘Home‘ to see the publish option in the menu.
- Click on the ‘Publish’ button and then select any workspace. By default, it will be ‘My Workspace‘. Select it and press the ‘OK or Select’ button at the bottom.
Check Out: What is Dax in Power Bi? Click here
Add Members To A Role
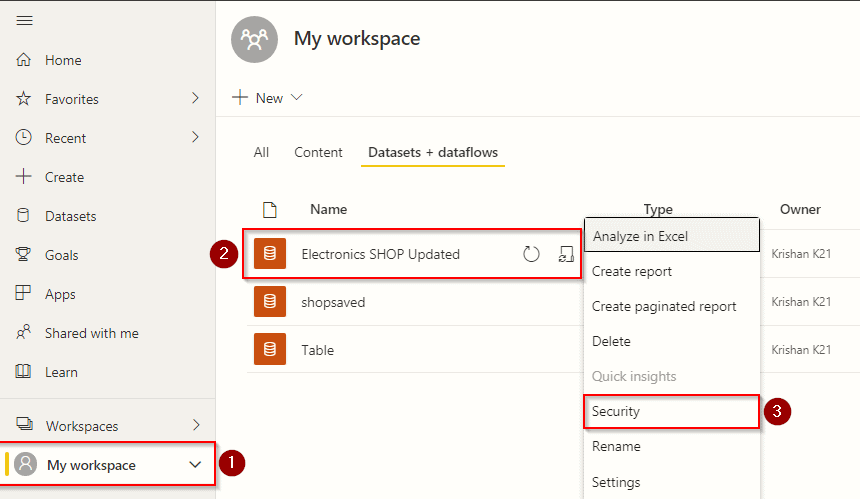
- Visit the ‘My workspace‘ section where you saved your data, as shown in the image below. Here you will see all your previous projects and reports.
- Visit the dataset section of this workspace. Find your latest dataset and 0pen the ‘3 dots menu‘ as shown in the image above.
- Select the ‘Security‘ option to check all the row-level security roles you have made for this dataset.
A similar screen will appear in front of you, as shown in the above image.
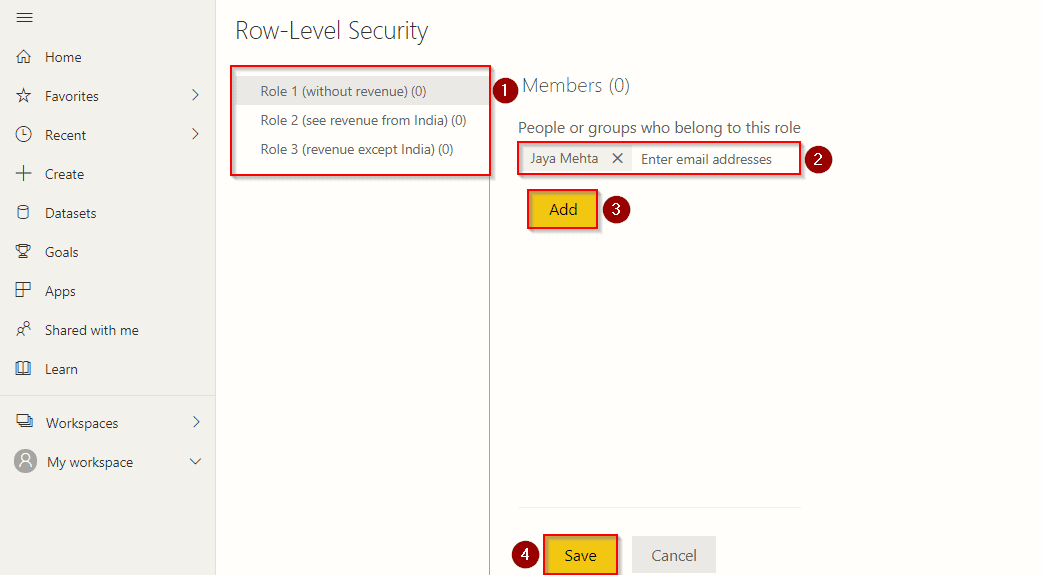
- Here you can check all the roles you have created on the Power BI desktop. Select the role where you want to add some members. Remember, these datasets and roles will only be visible when you publish your report in the desktop version.
- Enter the email address of the person that you want to add to this role. You can only fill in the person’s email address connected with the same corporate email you are using. Also, the emails that you will add here should be registered in Power BI.
- Click the button ‘Add‘ to add multiple emails to a role.
- Finally, click on the ‘Save‘ button when you are done with the changes.
Read More: About power query power bi. Click here
Remove Members From A Role
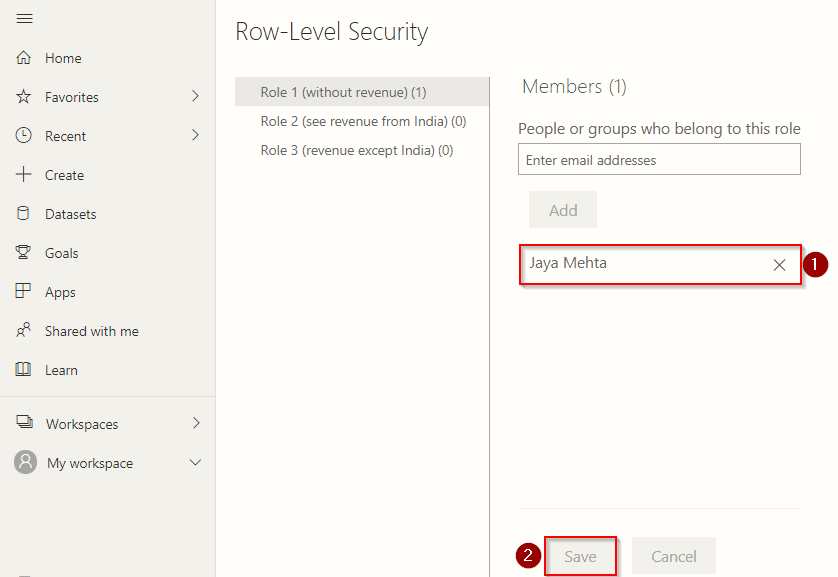
Similar to the above step, you can remove the members that you have added to a role. Select the role from where you want to remove a member.
- Here you will see all the members you have added in the past. Click on the ‘cross‘ present at the end of the members name as shown in the above image.
- Save your changes, and you are done with removing members and updating your changes.
Check Out: How to do Data Analysis using Power Bi. Click here
Conclusion
Power BI is owned by the leading IT & software company Microsoft. Power BI is one of the efficient tool provided by Microsoft for creating reports and visualizations using raw data. You may need to work around a huge amount of data in creating reports. And it would be best if you did not compromise the security of your confidential data at any cost. Ensuring data security in Power BI is possible by using various tools available in the application. Thus using Power BI, you make sure that your data is in your full control. You can secure your data by applying restrictions based on roles using row-level security.
Get Certified For Power BI: Microsoft [PL-300]
Microsoft Certified: Power BI Data Analyst Associate [PL-300] Certification is a great start to prove your Power BI skills in the job market. This certification is very useful to Data Analysts, BI Practitioners or business report designers who use Power BI to make use of their data in creating visualizations for customers or organizations for insights..
References
- Introduction to Microsoft Power BI Platform | Everything You Must Know
- Exam PL-300: Microsoft Power BI Data Analyst | A Replacement Of DA-100
- Microsoft Certified Data Analyst Associate [PL-300] Step By Step Activity Guides (Hands-On Labs)
- Case Study: Display Live Data Streaming Using Power BI Service
Next Steps to begin with PL-300 Certification:
In our PL-300 Certification Training Program, we’ll cover 10+ Hands-On Labs. If you wish to start your journey towards becoming a Microsoft Certified: Power BI Data Analyst Associate, try our FREE CLASS.


![AWS DevOps [DOP-C02] Professional Step By Step Activity Guides (Hands-On Labs)](https://k21academy.com/wp-content/uploads/2023/02/DOP-C02-1.png)