


![]()
Data comes in an unformatted structure, and it requires a skill set to format the data and extract valuable insights from it. To analyze and extract data, we need a tool, and if someone asks me which tool I use for analyzing the data; Without a second thought, I will name Power BI. Undoubtedly, Power BI transforms data in a correlative and interactive manner to analyze, extract and visualize it.
This blog is all about Cleaning, Transforming, and Loading Data in Power BI.
The topics covered in the blog include:
Before starting, one should know what they are working on, so here is a brief for the two things we will work on.
Power BI Desktop
Power BI Desktop is an application that helps connect, extract, transform, load, model, and visualize data. Power BI Desktop also assists in building report and model data.
Power Query Editor
It is the built-in Business Intelligence instrument present in Power BI Desktop to clean and transform your data. Any changes in the data are made with the help of Power Query Editor. All of the functions we will perform in this blog are done on Power query Editor.
Now the question arises what section do you go into to transform and reshape data in power bi?
Data Editing helps you to change and reshape data in Power BI.
To get Power Query Editor, select Home > Transform data in Power BI Desktop.
Let’s start!!
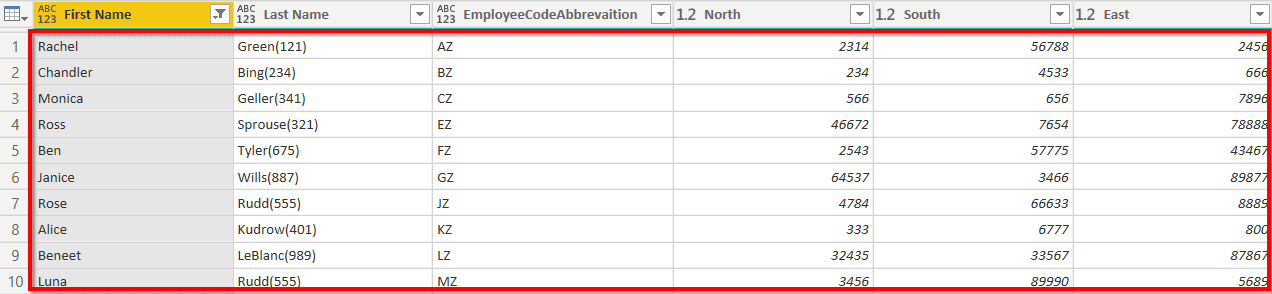
So, we will import our data from Excel, and here is the sample data we use for this blog. You can also download the Data Sheet.
We will work on Power BI Desktop, so if you don’t have Power BI Desktop, then download from here.
Power BI Transform Data – Steps
The transformation steps can be performed in any order after importing data into Power Query Editor.
Import Data
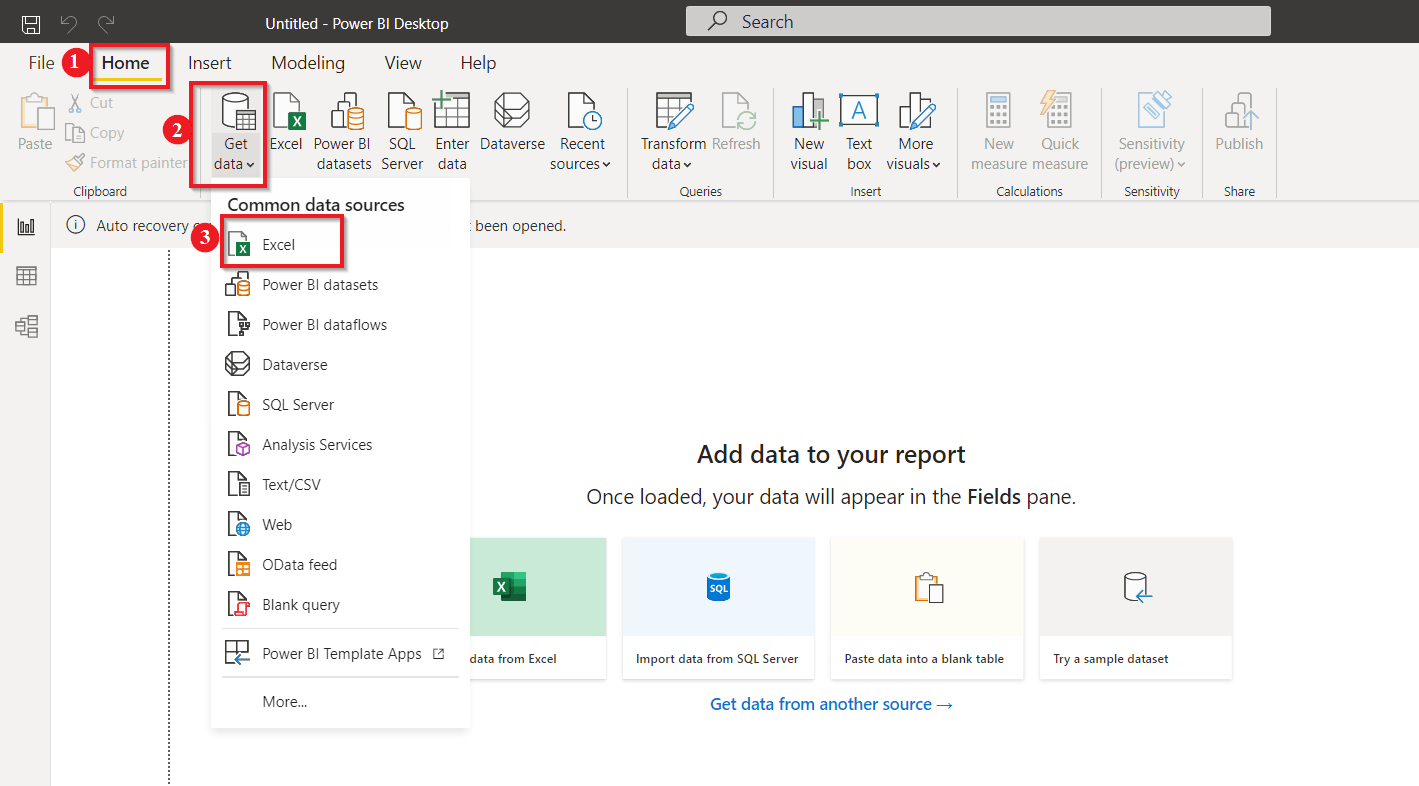
Today we will be working on data sourced from Excel. The first and foremost thing to do is import the data from the source to the Power BI. To import data, follow the step below:
- Go to the “Home” tab in the ribbon section.
- Click on “Get Data,” it will provide you with the options to source the data from a different platform.
- As we have our unsorted data in Excel, Select “Excel.”
Then, it will open a window to select the “Excel file” that you want to upload from your computer.
Next, the “Navigator” page asks you to select the datasheets you want to work with; check to mark the sheets you wish to.
As we are intended to sort our data, we will go with the “Transform Data” option.
By clicking on Load, the file gets uploaded without any transformation.
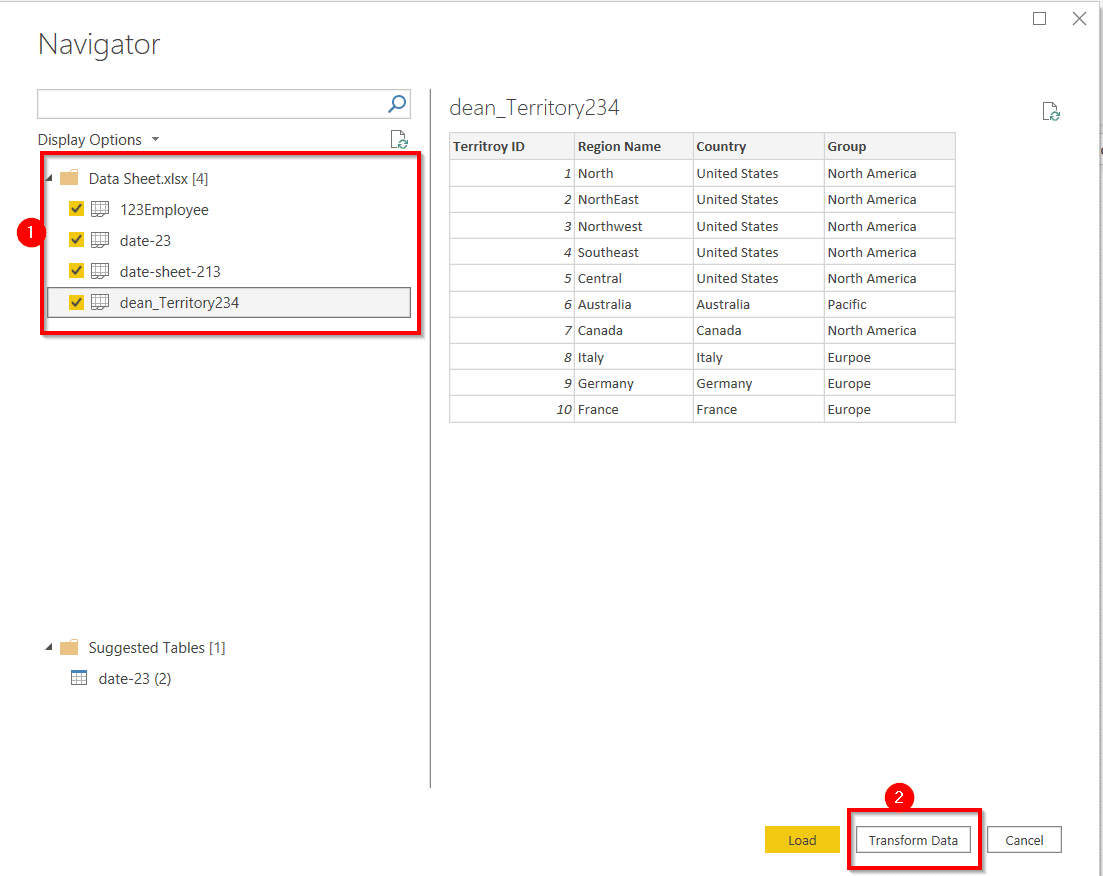
The Power BI transforms data button takes you to the other window, popularly known as Power Query Editor, where we will clean and transform our data.
To warm you up, let’s start with the easy one.
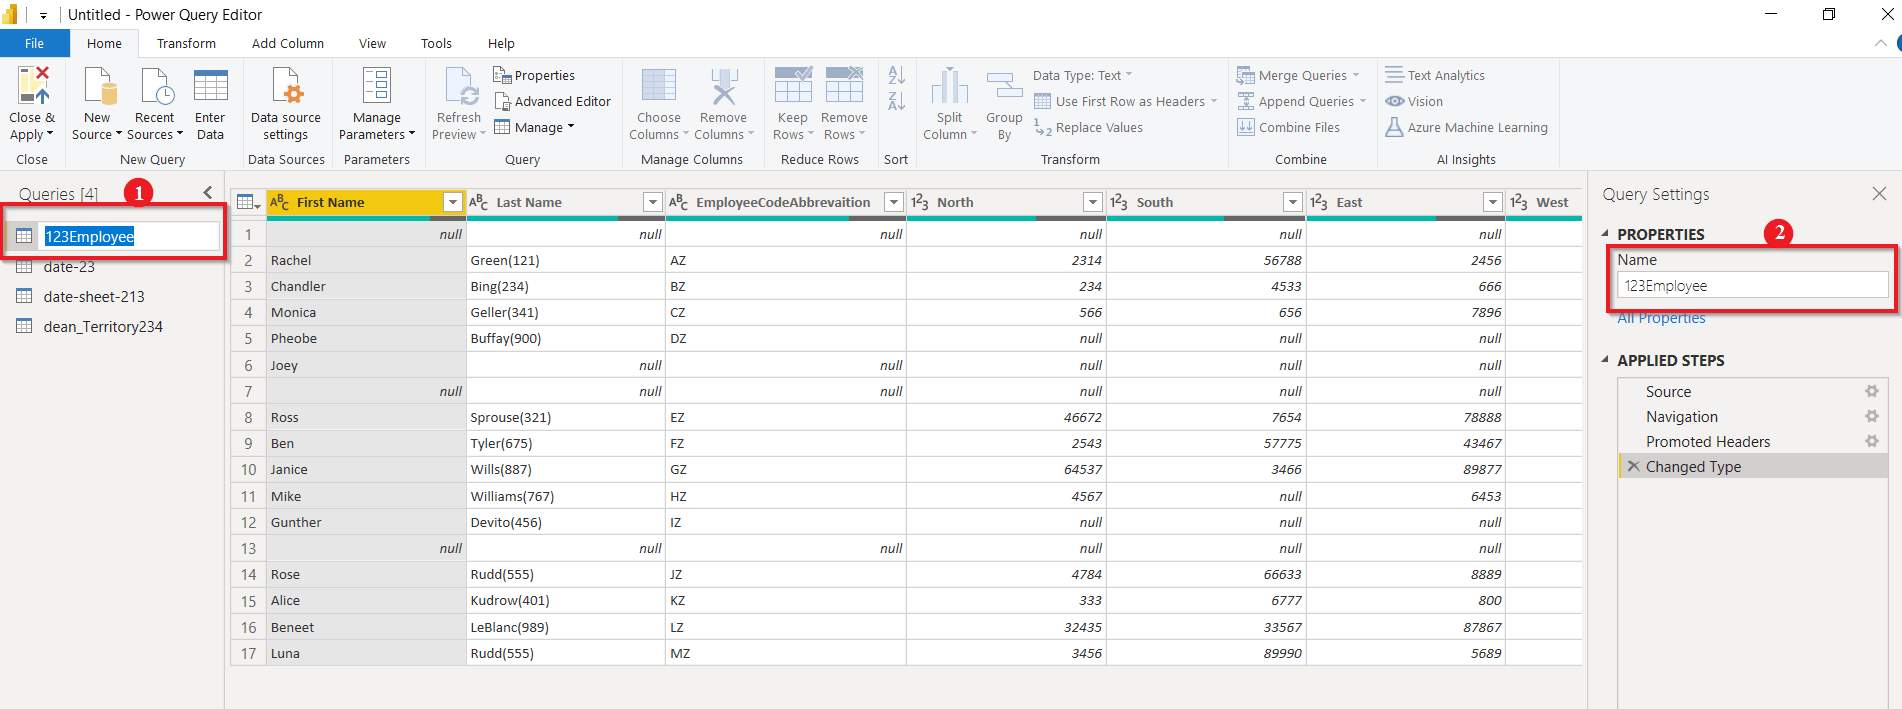
Changing the Table Name
Let’s say we are not satisfied with table names, and to avoid confusion, we wish to change its name.
The table name can be changed from both the options shown in the picture below:
Just double-click the name you want to change and specify the new name, and there you go.
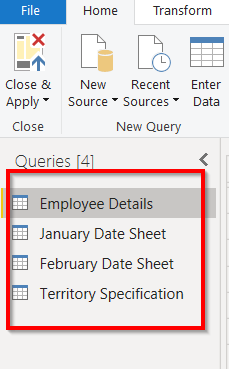
After changing all the table names, the result will look like this.
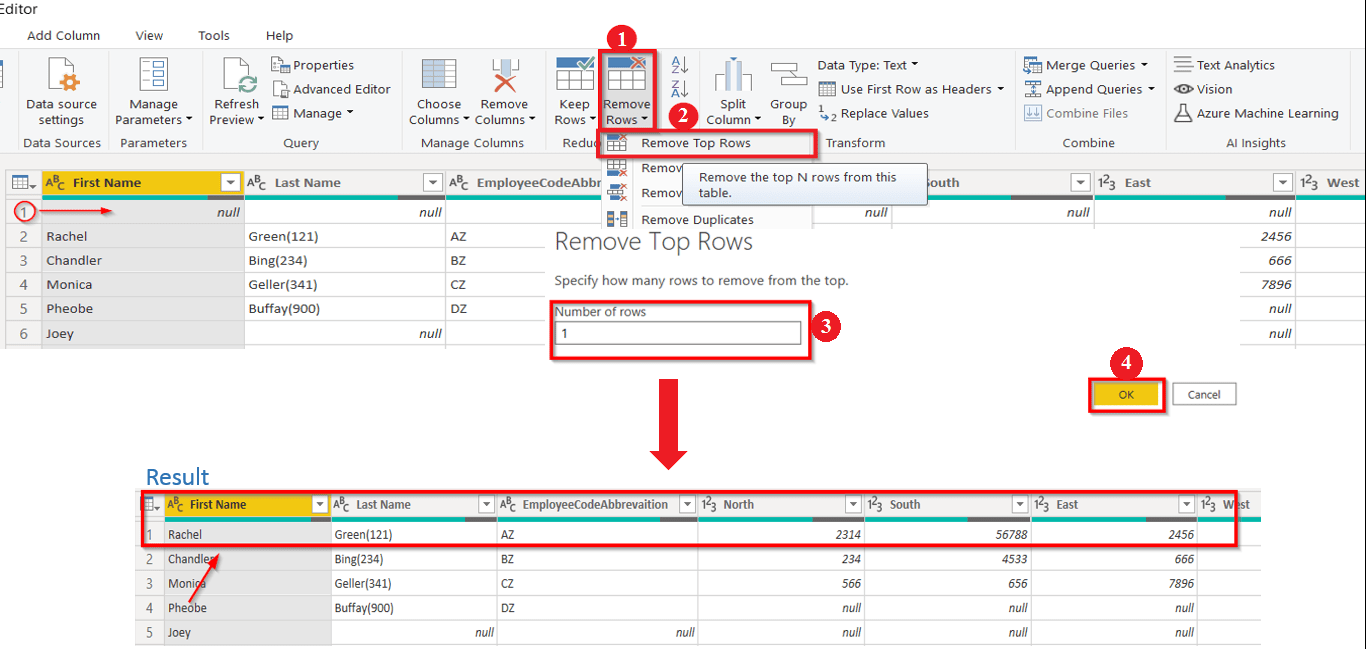
Remove the First Row
Let’s move ahead and remove the first null row:
- Go to the “Home” tab, select “Remove Rows.”
- From the drop-down list, select “Remove Top Rows.”
- Then, it will ask you to specify the number of rows you want to remove from the top.
- Here we will remove the top row only; therefore, we specify 1, click on “OK.”
The final result is shown in the image.
Replace Null Value
Let’s try replacing a value, say we want to replace all the null values in our data with ‘0’.
- Select all the columns you want to replace the value, “Right-Click,” on any row containing the null value. Select “Replace Values.”
- It asks you to specify the value you want to replace.
- Then next, set the value you want to replace with.
- Click on “OK.”
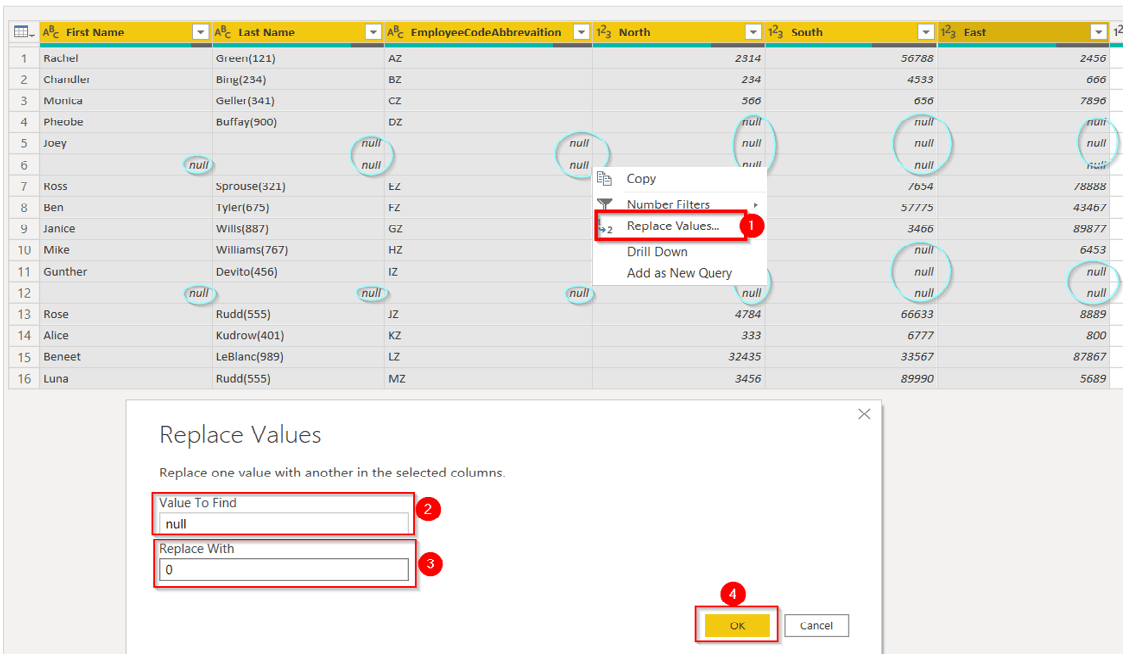
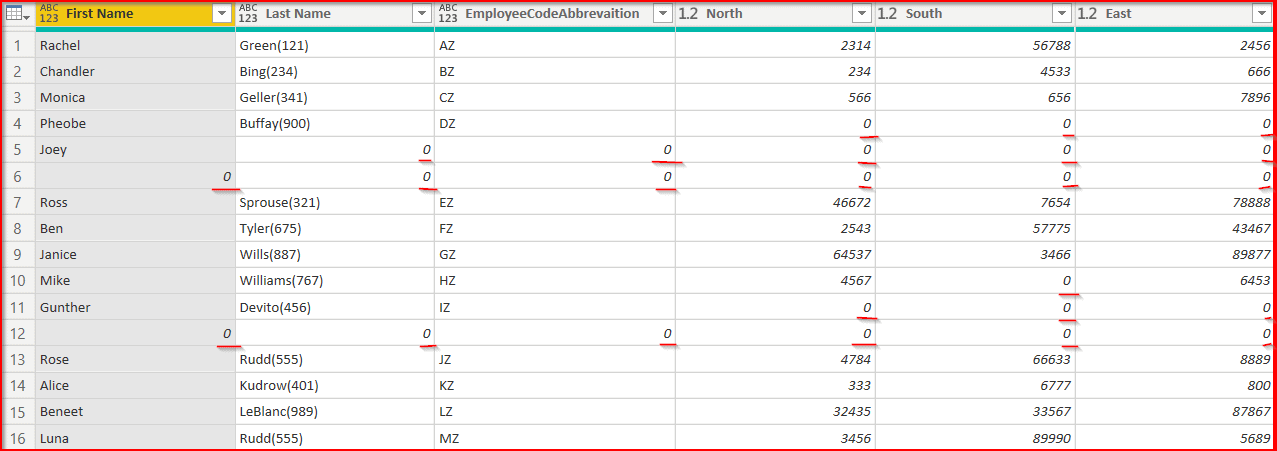
Here you see the result; all the null values have been replaced by 0.
Also, Read Our blog post on Data Analysis in Power Bi. Click here
Remove Unnecessary Rows
We want to remove all the unnecessary rows to make our data more readable in the next step. Lets’s say we want to remove rows that contain 0 in their data.
- Select the first column, drop down the list by “Left-Click.”
- Deselect all the items you don’t want in your datasheet.
- Click on “OK.”
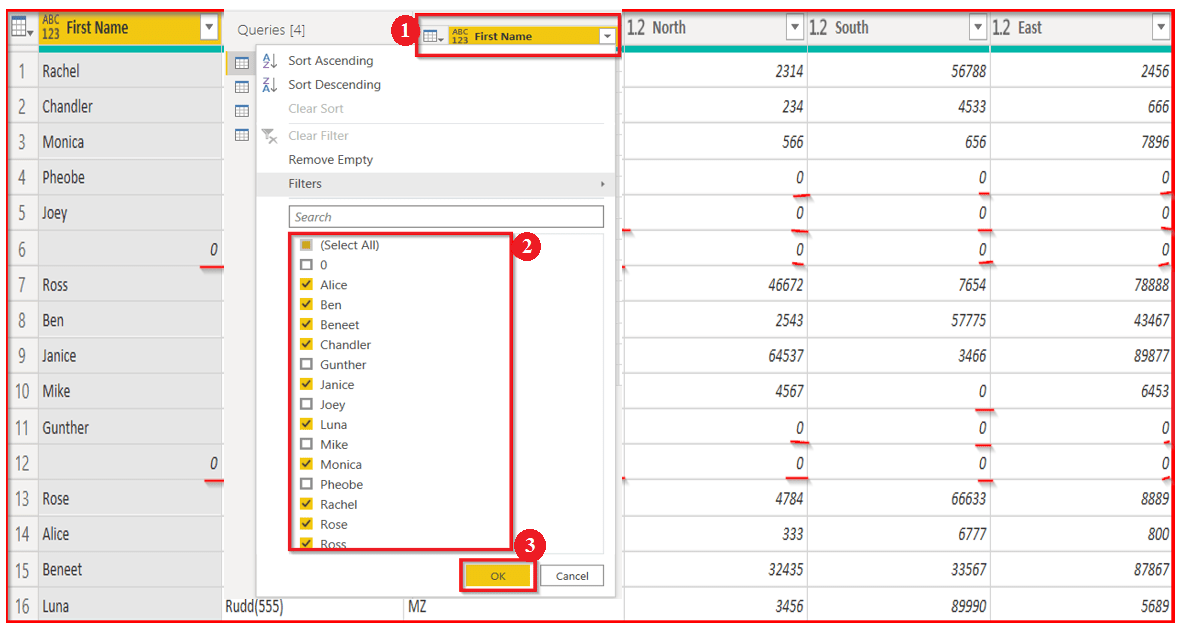
The sorted sheet after removing all the unnecessary rows will look like this.
Rename Column Headings
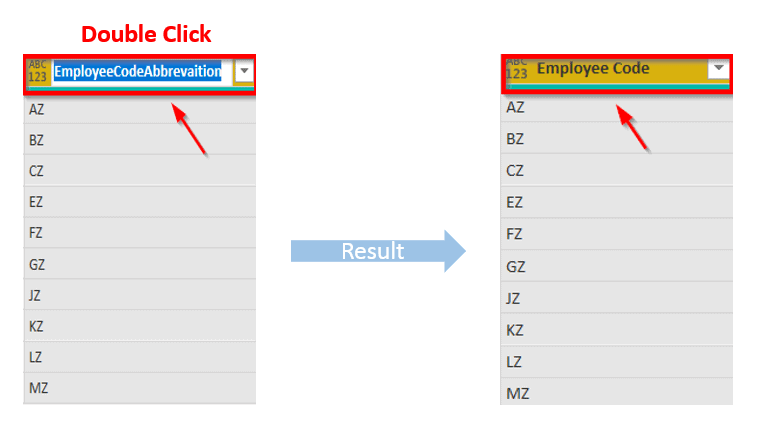
The most straightforward task in Power BI is to Rename the column heading.
“Double Click” on the column heading will get highlighted with a blue mark, then replace the name with a new header.
Also, Check: How to create Paginated Reports in Power Bi. Click here
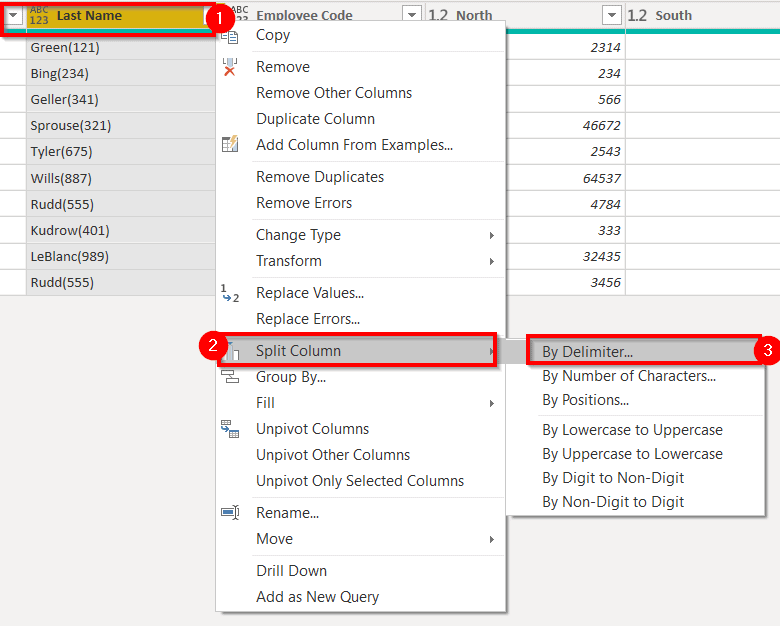
Separating into two Columns
Now what we want is to split the name and employee id into their column.
- Select the column “Right-Click” on the column heading.
- A drop-down list will appear; select “Split Column.”
- Then we go for “By Delimiter” to split the column.
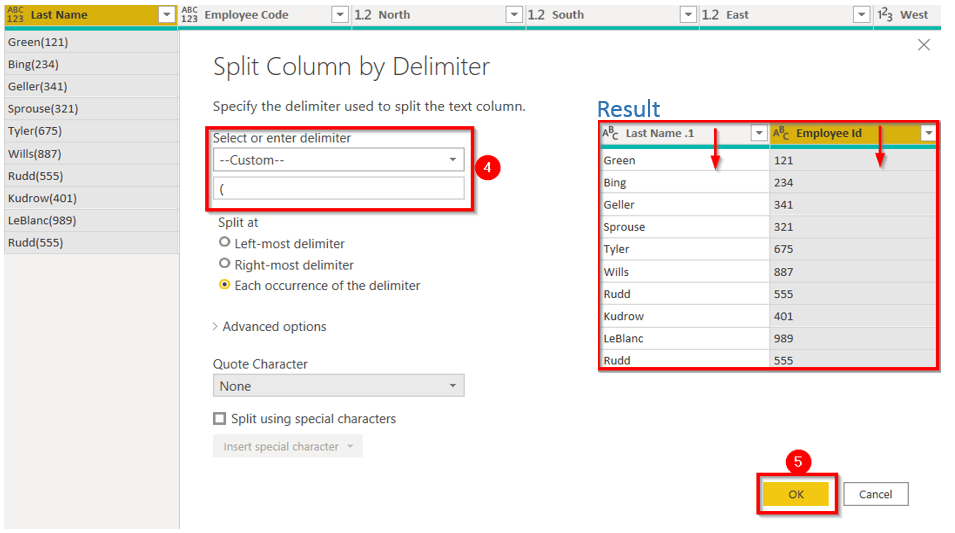
4. The ‘Split Column by Delimiter‘ page appears; we want to separate the column from the open parenthesis; thus, we customize the option and fill “(“ in the box.”
5. Click on “OK.”
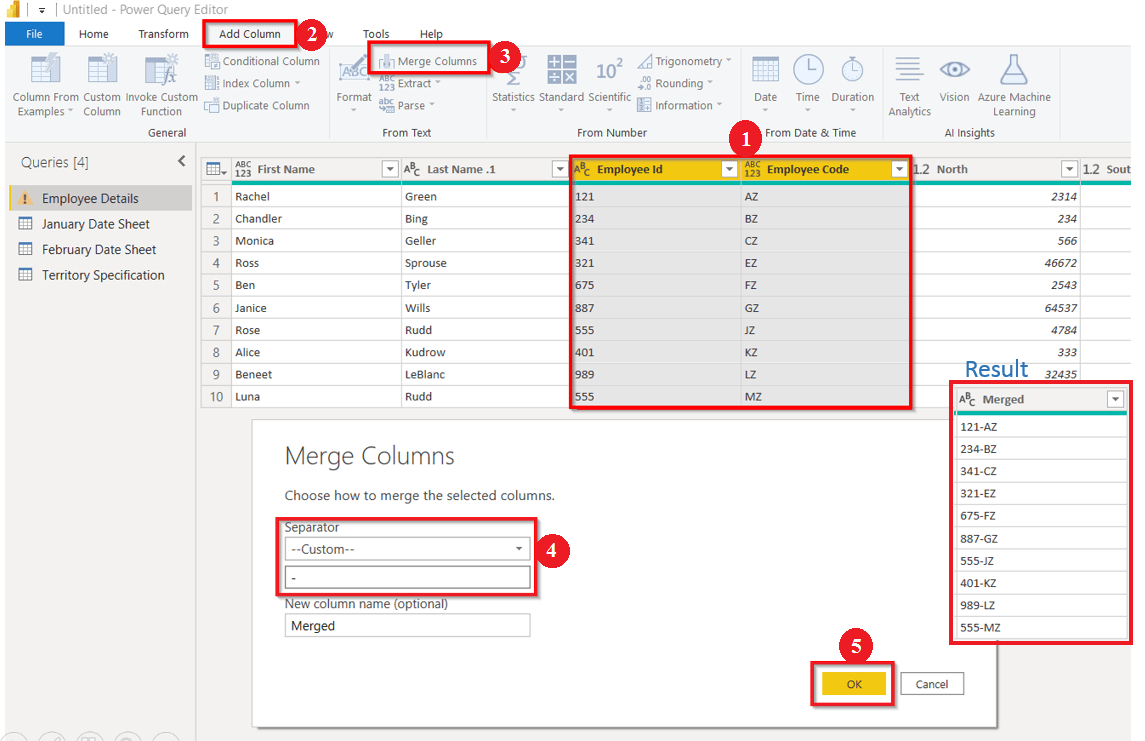
Merge Columns
I can almost hear you thinking about what we need to merge two columns, so here you go.
- Select the two columns you want to merge.
- Go to “Add Column.”
- Select the “Merge Columns” option.
- Merge Columns page will appear; specify the separator.
- Click on “OK.”
Also, Check Our blog post on Power bi Microsoft Azure. Click here
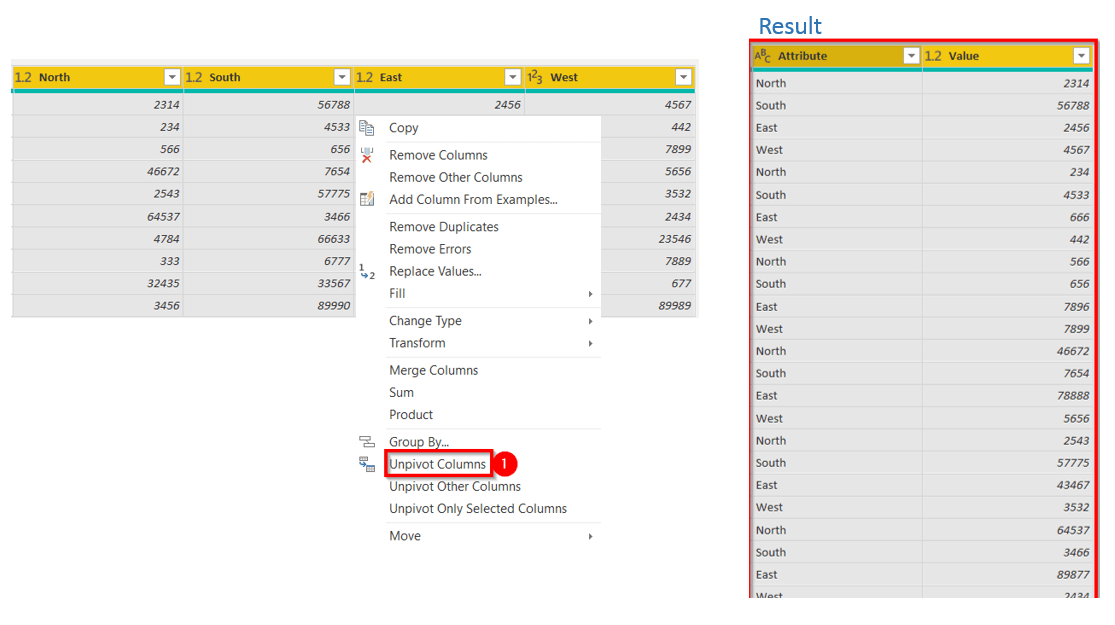
Unpivot the Columns
Unpivot column means to unpack the similar values and group them under a single heading. When we look at our unsorted data, we see that all the four columns North, South, East, and West, show the same metric. Therefore we want to separate it into two columns where one column will show Region and the other Sale.
Select all four columns, Right-click on any heading, and then select “Unpivot Columns.”
It will result in it two new columns, name Attribute, and Value. Change the column name.
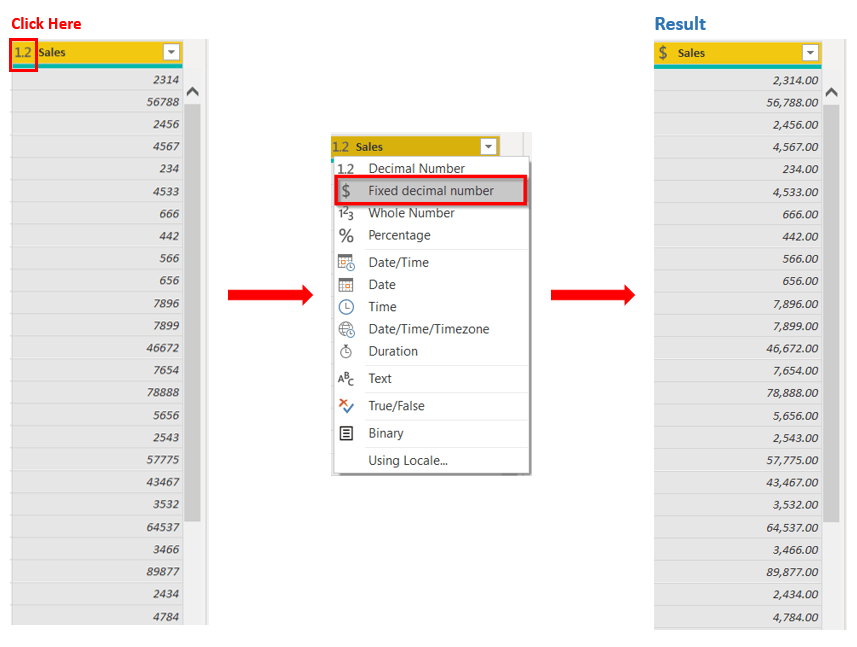
Change Data Type
If we want to change the data type:
- Select the column and “Right-Click” on the column header.
- A drop-down list will appear; select “Change Type.”
- Now, again a drop-down list will appear with different data types. Select the data type according to you.
Here we have selected Fixed Decimal number, and you can see the results after the transformation in the below image.
Also, Read Our blog post on Tableau vs. Power bi Cost. Click here
Append Queries
Now let’s move ahead with the bit of challenging task of combining two tables.
We have two sheets January Data Sheet and February Data Sheet, and we want to combine both these tables into a single sheet.
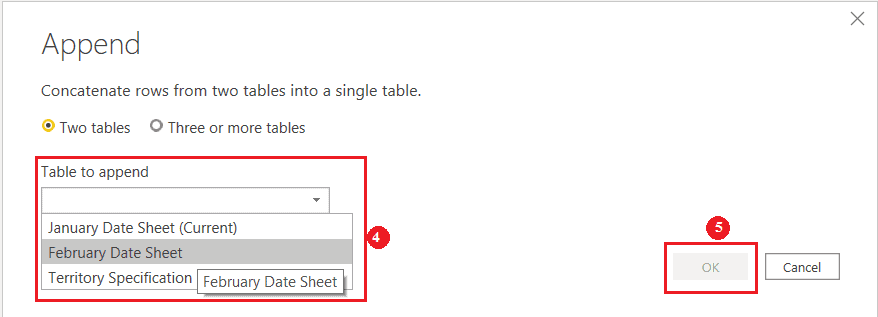
- Select the table sheet in which you want to add rows. Here, we will add the February Data sheet into January Data Sheet.
- Go to the “Home tab.”
- Select “Append Queries” and click on “Append Queries.”
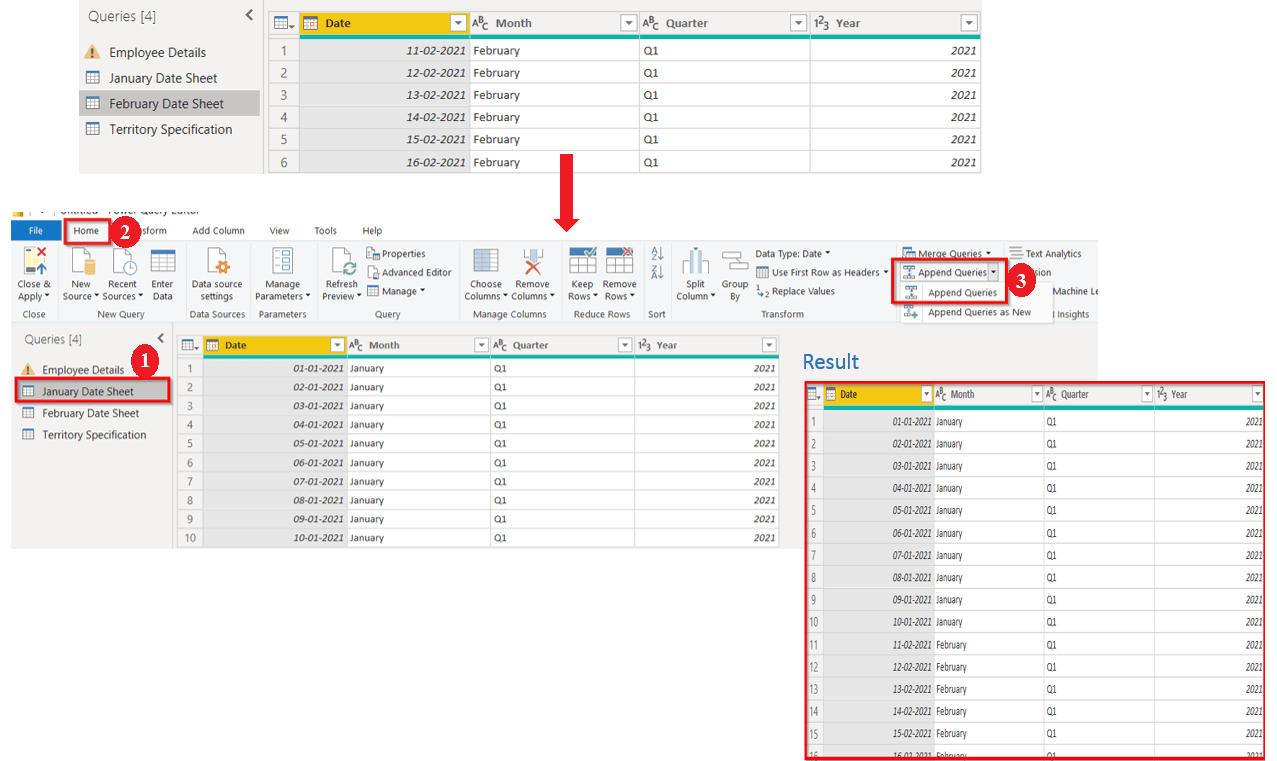
4. Next, it will take you to the Append page and asks you to select the table you want to append. You can append two or more tables. We want to append-only two datasheets; therefore, we have selected the “Two tables” option below.
5. Click on “OK,” the result is shown in the above image.
Also, Check Our blog post on Dax Expressions in Power Bi. Click here
Conditional Column
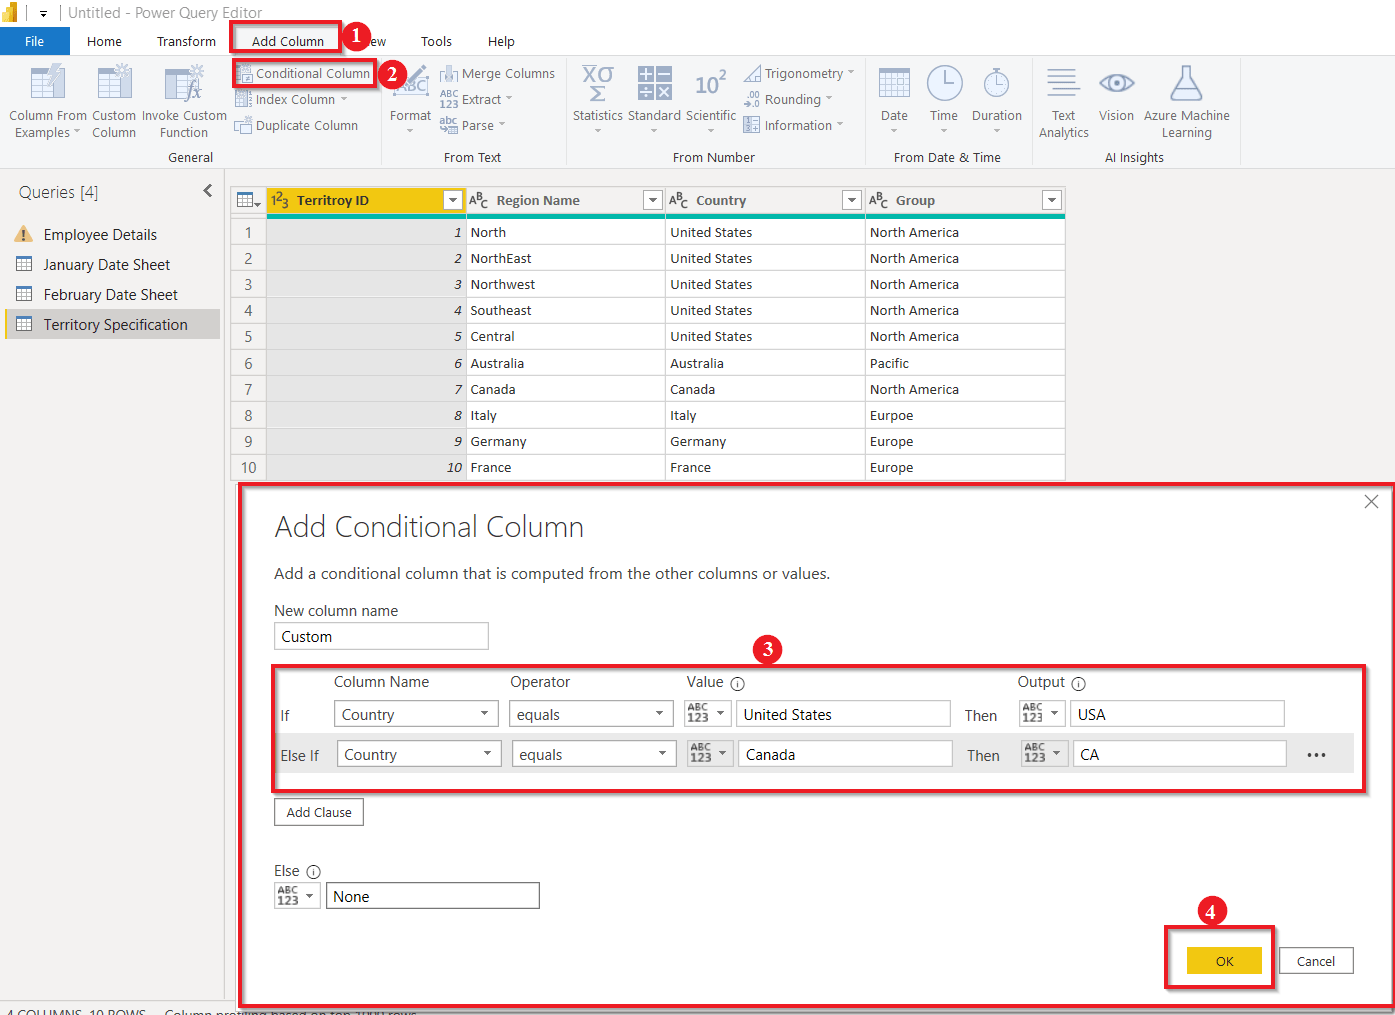
The conditional Column is similar to the IF-Else statement in Excel. It generates columns according to conditions and specified logic.
Let’s say we want to specify the country abbreviations according to the group they are in. For example, We want to select the USA for all the groups named ‘North America.’ To do this, follow the steps.
- Go to “Add Column.”
- Select “Conditional Column.”
- ‘Add Conditional Column‘ page will appear, where you will specify the conditions. First, it asks you to give a name to a new column; by default, it sets the name as Custom if you don’t specify any new name.
- Fill in the condition according to your need and click on “OK.”
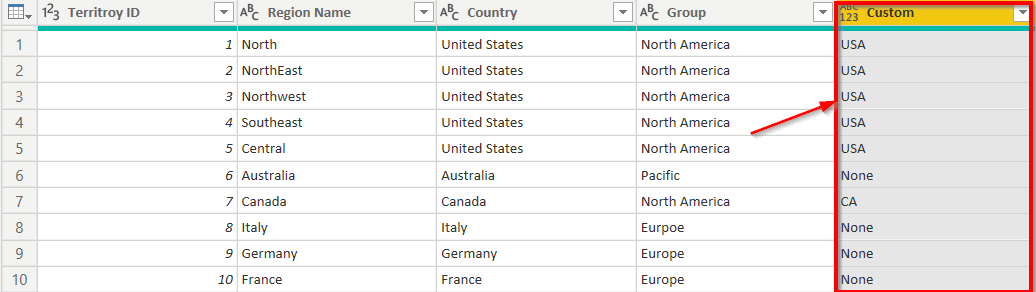
After the conditional columns are applied, the final result looks like this.
Also, Check Our blog post on the Microsoft Power Query. Click here
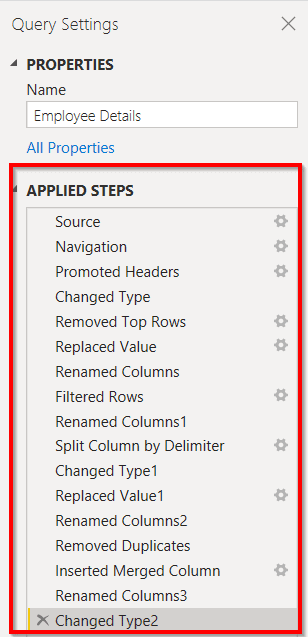
Power BI transforms data – Applied Steps
In Power BI Query Editor, all the shaping steps taken are reflected under “APPLIED STEPS.” If you feel the particular action is not required, you can remove it by clicking X present on the left side of the step.
As soon as you are done with the data transformation procedure, save the query.
Go to the “Home” tab and click on the “Close & Apply” button to save the data. It is the final step that will load your data.
Easy right?? Isn’t it fair to say that Power BI is convenient to use?
Conclusion
Power BI Desktop and Power Query Editor are potent tools to clean and transform your data. All the actions and processes of Power BI transform data can be performed very quickly and smoothly. Everything we did today in the blog is mainly based on clicks. Once you get to know about it, it becomes effortless to sort the data. I hope this blog has been helpful to you. Keep Reading.
References
- Introduction to Microsoft Power BI Platform | Everything You Must Know
- Exam PL-300: Microsoft Power BI Data Analyst | A Replacement Of DA-100
- Microsoft Certified Data Analyst Associate [PL-300] Step By Step Activity Guides (Hands-On Labs)
- Case Study: Display Live Data Streaming Using Power BI Service
- Introduction to Data Modeling in Power BI
- What is Power Query | Microsoft Azure Power BI Tool
- Table and Matrix Visualization in Power BI
- Azure Power BI: Step-by-Step Integration
- Top 15 Differences Between SSRS vs Power BI
Next Steps to begin with PL-300 Certification:
In our PL-300 Certification Training Program, we’ll cover 10+ Hands-On Labs. If you wish to start your journey towards becoming a Microsoft Certified: Power BI Data Analyst Associate, try our FREE CLASS.


![AWS DevOps [DOP-C02] Professional Step By Step Activity Guides (Hands-On Labs)](https://k21academy.com/wp-content/uploads/2023/02/DOP-C02-1.png)