

![]()
This blog tells you the best way to Create alerts for Azure SQL Managed Instance Database utilizing the Azure portal. Alerts can send you an email, runbook, execute Azure Function, call a webhook, call an outside ITSM viable tagging framework, call you on the telephone or send an instant message when some metric, such as instance occurrence stockpiling size, or CPU utilization, comes to a predefined limit. This blog likewise gives best practices for setting alerts periods.
Topics we’ll cover :
- Introduction
- Alerting Metrics Available For Managed Instance
- Create An Alert Rule On A Metric With The Azure Portal
- Suspend, View, Modify, Activate and Delete Existing Alert Rules
Introduction
You can receive an alert based on monitoring metrics for your Azure services, or events.
- Metric values – The alert triggers when the value of a specified metric crosses a threshold limit you assign in either direction. That is, it triggers both when the condition is first met and then afterward when that condition is no longer being met.
You can Configure the alert using the following triggers.
- Call a webhook
- Call Azure Function
- Call Azure runbook
- Call a phone number with a voice prompt
- Send text messages to the phone number
- Send emails to additional emails that you specify
- Call an external ticketing ITSM Compatible system
Alerting Metrics For Managed Instance
Alert metrics are available for managed instances only. Alerting metrics for individual databases in the managed instances are not available. Database diagnostics telemetry is on the other hand available in the form of diagnostics logs. Alerts on diagnostics logs can be set up from within SQL Analytics product using log alert scripts for managed instance
The following managed instance metrics are available for alerting configuration:
| ALERTING METRICS AVAILABLE FOR MANAGED INSTANCE | ||
| Metric | Description | Unit of measure \ possible values |
| Virtual core count | vCores provisioned for the managed instance. Changes with resource scaling operation. | 4-80 (vCores) |
| IO bytes read | IO bytes read in the selected time period. | Bytes |
| IO bytes written | IO bytes are written in the selected time period. | Bytes |
| Storage space reserved | Current max. storage space reserved for the managed instance. Changes with resource scaling operation. | MB (Megabytes) |
| Storage space used | Storage space used in the selected period. Changes with storage consumption by databases and the instance. | MB (Megabytes) |
| IO requests count | Count of IO requests in the selected time period. | Numerical |
| Average CPU percentage | The average percentage of CPU utilization in the selected time period. | 0-100 (percent) |
Create An Alert Rule On A Metric With The Azure Portal
- In the Azure portal, locate the managed instance you are interested in monitoring and select it.
- Select the Metrics menu item in the Monitoring section.

- On the drop-down menu, select one of the metrics you wish to set up your alert on (Storage space used is shown in the example).
- Select aggregation period – average, minimum, or maximum reached in the given time period (Avg, Min, or Max).
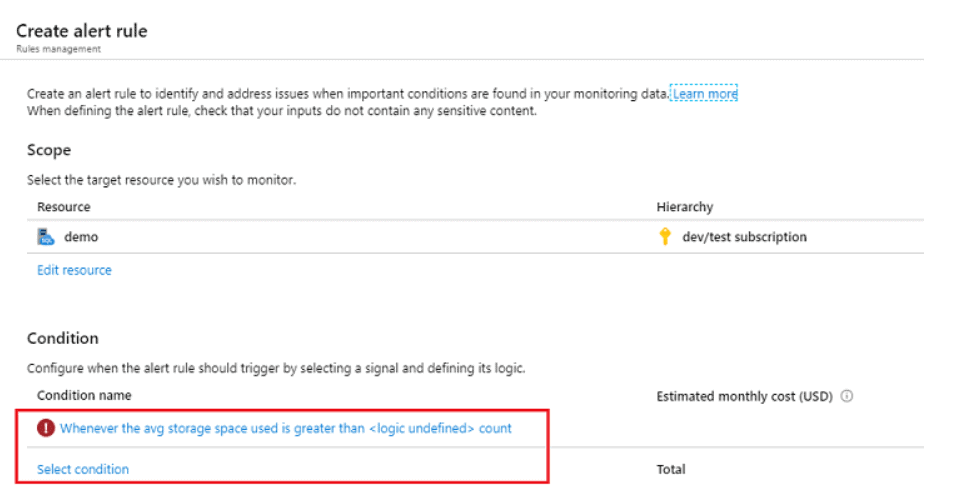
- Select New alert rule
- In the Create alert rule pane click on Condition name (Storage space used is shown in the example)

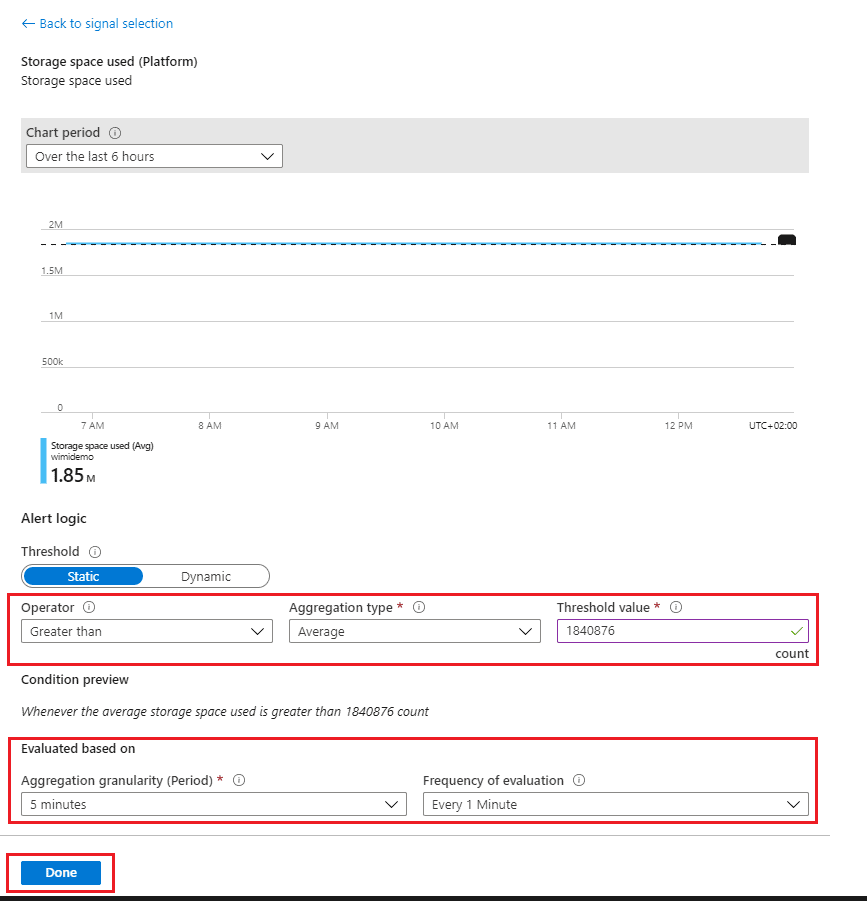
- On the Configure signal logic pane, define Operator, Aggregation type, and the Threshold value
- Operator type options are greater than, equal and less than (the threshold value)
- Aggregation type options are min, max, or average (in the aggregation granularity period)
- The threshold value is the alert value that will be evaluated based on the operator and aggregation criteria

- Set the evaluation period – aggregation granularity in minutes and frequency of evaluation. The frequency of evaluation will denote the time the alerting system will periodically check if the threshold condition has been met.
- Select action group. Action group pane will show up through which you will be able to select an existing or create a new action. This action defines what will happen upon triggering an alert (for example, sending an email, calling you on the phone, executing a webhook, Azure function, or a runbook, for example).
- To create a new action group, select +Create action group for the alerts
- Define how do you want to be alerted: Enter an action group name, short name, action name, and select Action Type. The Action Type defines if you will be notified via email, text message, voice call, or if perhaps webhook, Azure function, the runbook will be executed, or ITSM ticket will be created in your compatible system.
- Fill in the alert rule details pane, select the severity type.


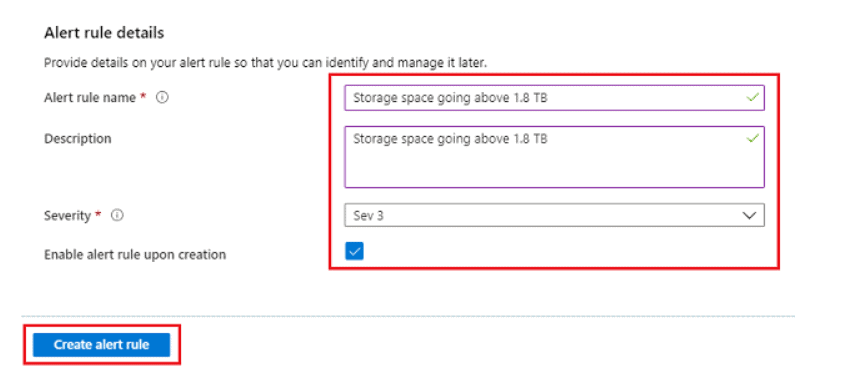
- Complete creating the alert rule by clicking on Create alert rule button.
The new alert rule will become active within a few minutes and will be triggered based on your settings.
Suspend, View, Modify, Activate And Delete Existing Alert Rules
1.) Search for the alerts in the search bar.
2.) On the alert pane, select the manage alerts.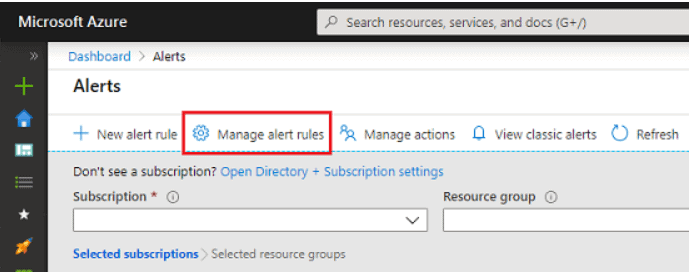
here a list of alerts is showing select an individual existing alert and manage it.
Related/References
- Exam DP-300: Microsoft Azure Database Administrator Associate
- Microsoft Certified Azure Database Administrator Associate(Hands-On Labs)
- Azure SQL Deployment Options | SQL Managed Instance | SQL Database| SQL On VM
- Migrate SQL Server To Azure SQL Database
- Implement A High Availability And Disaster Recovery Environment
- Use External Table On Azure SQL Managed Instance To Read Data From Azure SQL Database
- Optimize Query Performance In SQL Server
Next Task For You
We will cover all the exam objectives related to how to perform migrations, Hands-On Labs, and practice tests in our Azure Database Administrator training program. If you want to begin your journey towards becoming a Microsoft Certified: Azure Database Administrator Associate by checking our FREE CLASS.


![AWS DevOps [DOP-C02] Professional Step By Step Activity Guides (Hands-On Labs)](https://k21academy.com/wp-content/uploads/2023/02/DOP-C02-1.png)