![]()
Power BI is loaded with tons of features and tools. Power BI filter is an essential tool for visualizing data in Power BI Reports. In this post, we will give you a walkthrough of Power BI Filters, Add a filter into the Report, Format filters in Reports, Types of Filters in Reports and some other components.
In this blog, we’ll cover:
Power BI Filters
The process of filtering allows you to remove all the data that you don’t need, so you can focus on the data that you do need. You can apply filtering directly by using the Filters pane. They are used to sort the data based on some selected conditions. You have to select the values within a fields column and refine the result based on the criteria only.
For example, let’s say we have the dataset related to sales of the store. Using filters, we can dig out only the information needed. If you want to find total sales in Dubai for a Particular year, just set the year value that you want under the “year” section and “Dubai” under the country section.
Add a Filter to Report
A Report is a multi-perspective view of a dataset, with visuals representing different findings and insights. A report can have one visual or pages full of visuals. Depending on the role of your job, you may be someone who designs reports.
To add a filter in Power BI follow the below steps:
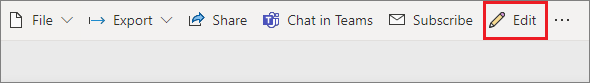
Step 1) In the Power BI service, select Edit to open your report in the Editing view.
Step 2) Open the Visualizations, Filters, and Fields panes, if they’re not already open.
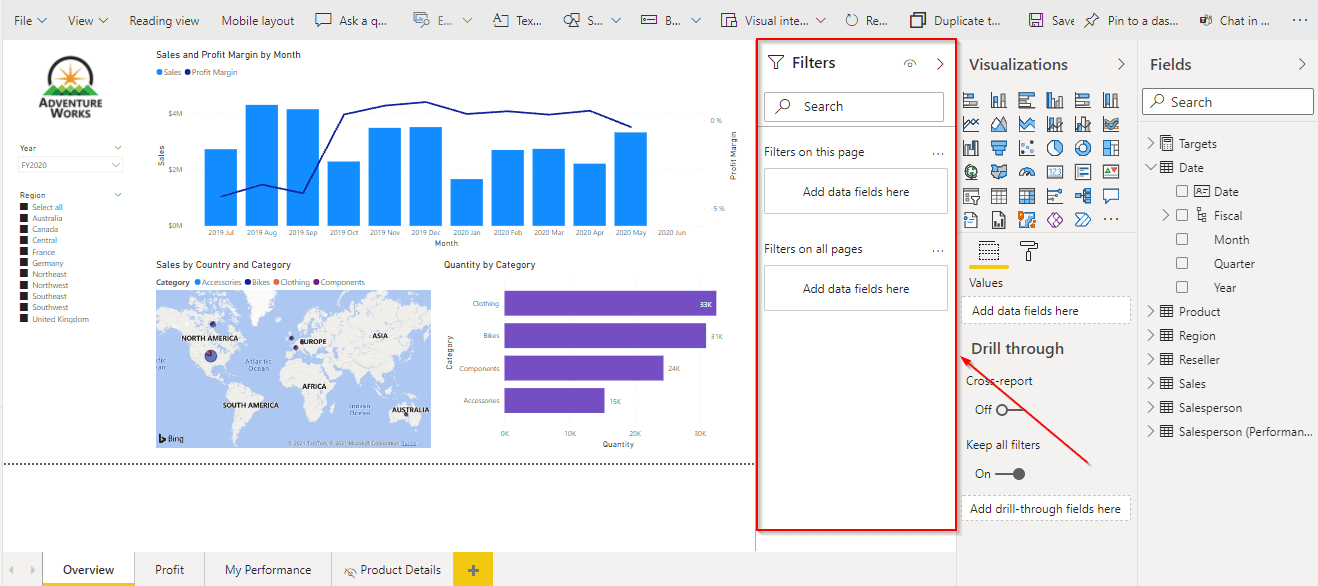
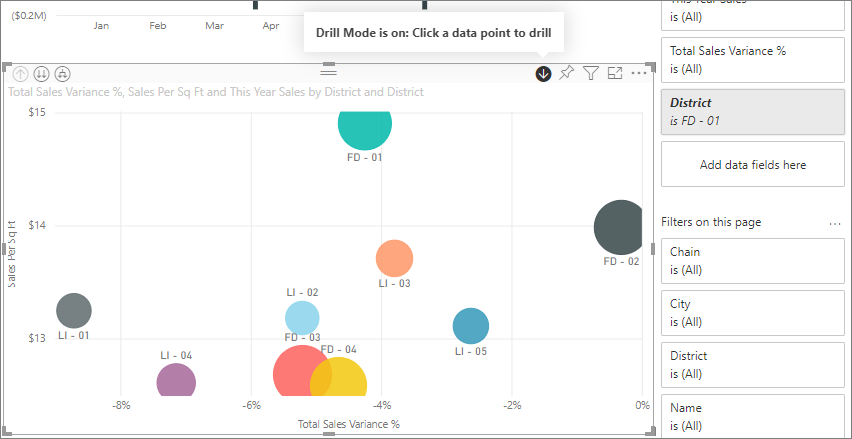
Step 3) Select a visual to make it active. In this case, it is the scatter chart on the Overview page. All the fields in the visuals are in the Visualizations pane. They are also listed in the Filters pane, under the Filters on this visual heading.
Check out – How to Design a Report in Power BI.
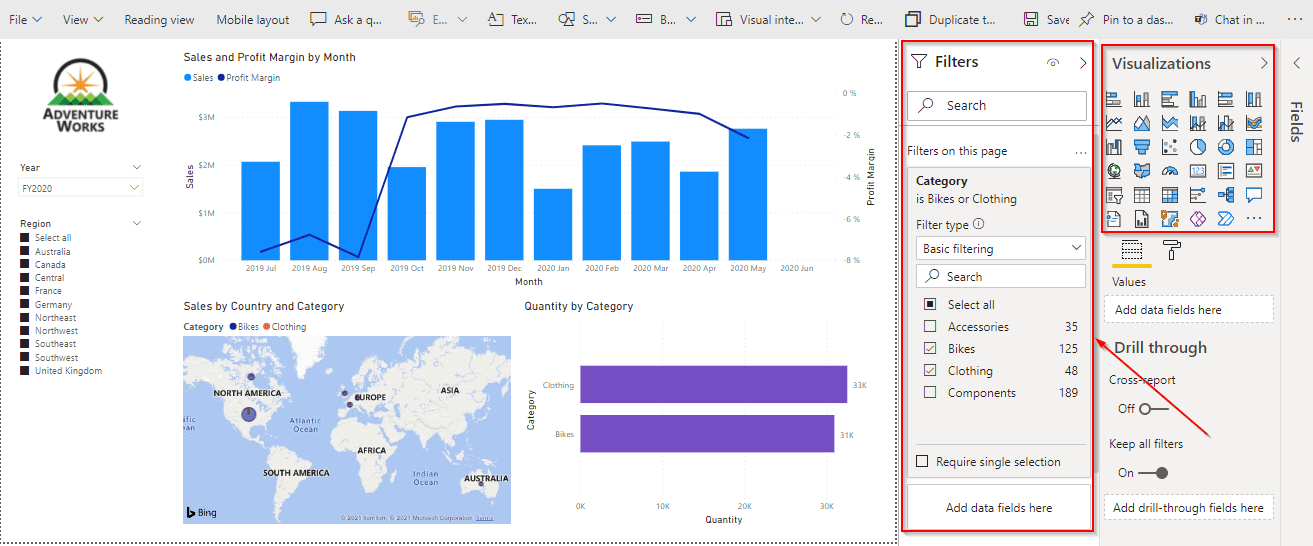
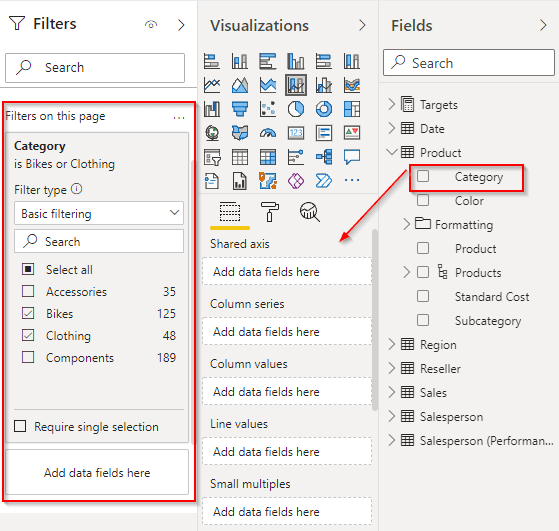
Step 4)From the Fields pane, select the field that you want to add the new visual-level filter and drag it into the Filters on this visual area. In this example, we can drag Category to Add data fields here.
Notice that Category is not added to the visualization itself.
 Notice Category is not added to the visualization itself.
Step 5) Select Bikes. Check out the Line and Stacked column chart, and the other visuals.
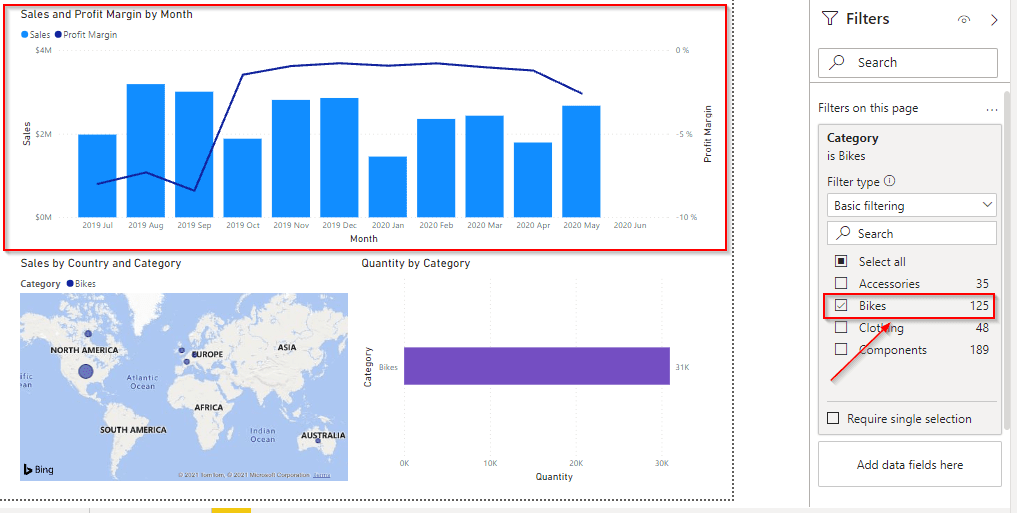
If you save your report with this filter, report readers can interact with the Category filter in Reading view, selecting or clearing values.
Also Check: Our blog post on Power bi KPI.
Types of Filters
Power BI has four different kinds of filters allowing you to apply filters on four different levels. It can be applied during an influence report or BI dashboard.

Visual-level Filters
Visual-level filters are the only filter data that is for a given view, whether it is a chart, table, scale, card, etc. These are the granular filters that can be used in your data, and they work with the content of both reporting levels and page-level filters, which means that visual-level filters can’t extract them and can’t be edited further to filter data in other visions.
Page-level Filters
This filter is for a specific page given in a report. A report is made up of a collection of pages. Filters can be applied based on the conditions on a specific page within the given report. Each page during a report can have the special set of filter conditions applied.
Report-level Filters
Report-level filters are the filters used in the filter condition on the entire report. Report-level Filters are the ones that affects all data in the report, no matter what you are looking at. These filters are the global filters.
Drill through Filters
By making use of this filter, you will create a page that mainly focuses on precise entities. you will add the extra details about your customer, user, manufacturer on a separate page and consider a manufacturer/specific customer/user from the fore-most report.
Automatic Filters
Automatic Filters are added to your PowerBI visuals, automatically, while building the visuals. These visuals are made according to the topic related to the visuals or fields. Users who have the permission of editing can further edit, sort or rename the file according to their preferences. These filters can’t be deleted as these are automatic filters regarding their visuals.
Manual filters
Manual filters are the filters that you can drag and drop in any section of the filter pane when you are editing a report. If you have edit permission to the report, you can edit, delete, clear, hide, lock, rename, or sort this filter in the pane.
Cross-drill Filters
These filters will be added automatically when drill-down filters pass it on to the different graphs. Other changes, which can also be not made as it is linked with the drill-down filter. Both the filters work together. You cannot even sort or edit it further. For removing it you have to delete the drill filter by selecting the drill up button for a visual for further passing that filter on.
Related References:
- Microsoft Certified Data Analyst Associate [DA100] Step By Step Activity Guides (Hands-On Labs)
- Microsoft Certified Data Analyst Associate [DA-100]: Everything You Need To Know
- [DA100 Day 1 Q/A Review] Data Analytics, Prepare Data in Power BI
- [DA100 Day 2 Q/A Review] Clean, Transform, And Load Data In Power BI
- [DA100 Day 3 Q/A Review] Work With Tables, Data Modeling, Data Granularity In Power BI
- [DA100 Day 5 Q/A Review] Work With Visuals and Create Data-Driven Story In Power BI
- [DA100 Day 6 Q/A Review] Analyze Performance, Reduce Cardinality Levels
- Difference Between Dashboards & Reports In Power BI
Next Steps To Begin With DA100 Certification:
In our Microsoft Data Analyst Associate Certification Training Program, we will cover 10+ Hands-On Labs. If you wish to start your journey towards becoming a Microsoft Certified: Data Analyst Associate[DA-100], try our FREE CLASS.

Leave a Reply