![]()
In this blog, we will go through some quick tips, including Q/A and Important topics that we covered in the Microsoft Data Analyst Associate Day 4 Live Session, which will help you to gain a better understanding and make it easier for you to
In Day 3 Session, we covered an overview of the Design of a Data Model in Power BI.
A week before, In Day 2 Session, we covered the topic on Clean, Transform, and Load in Power BI.
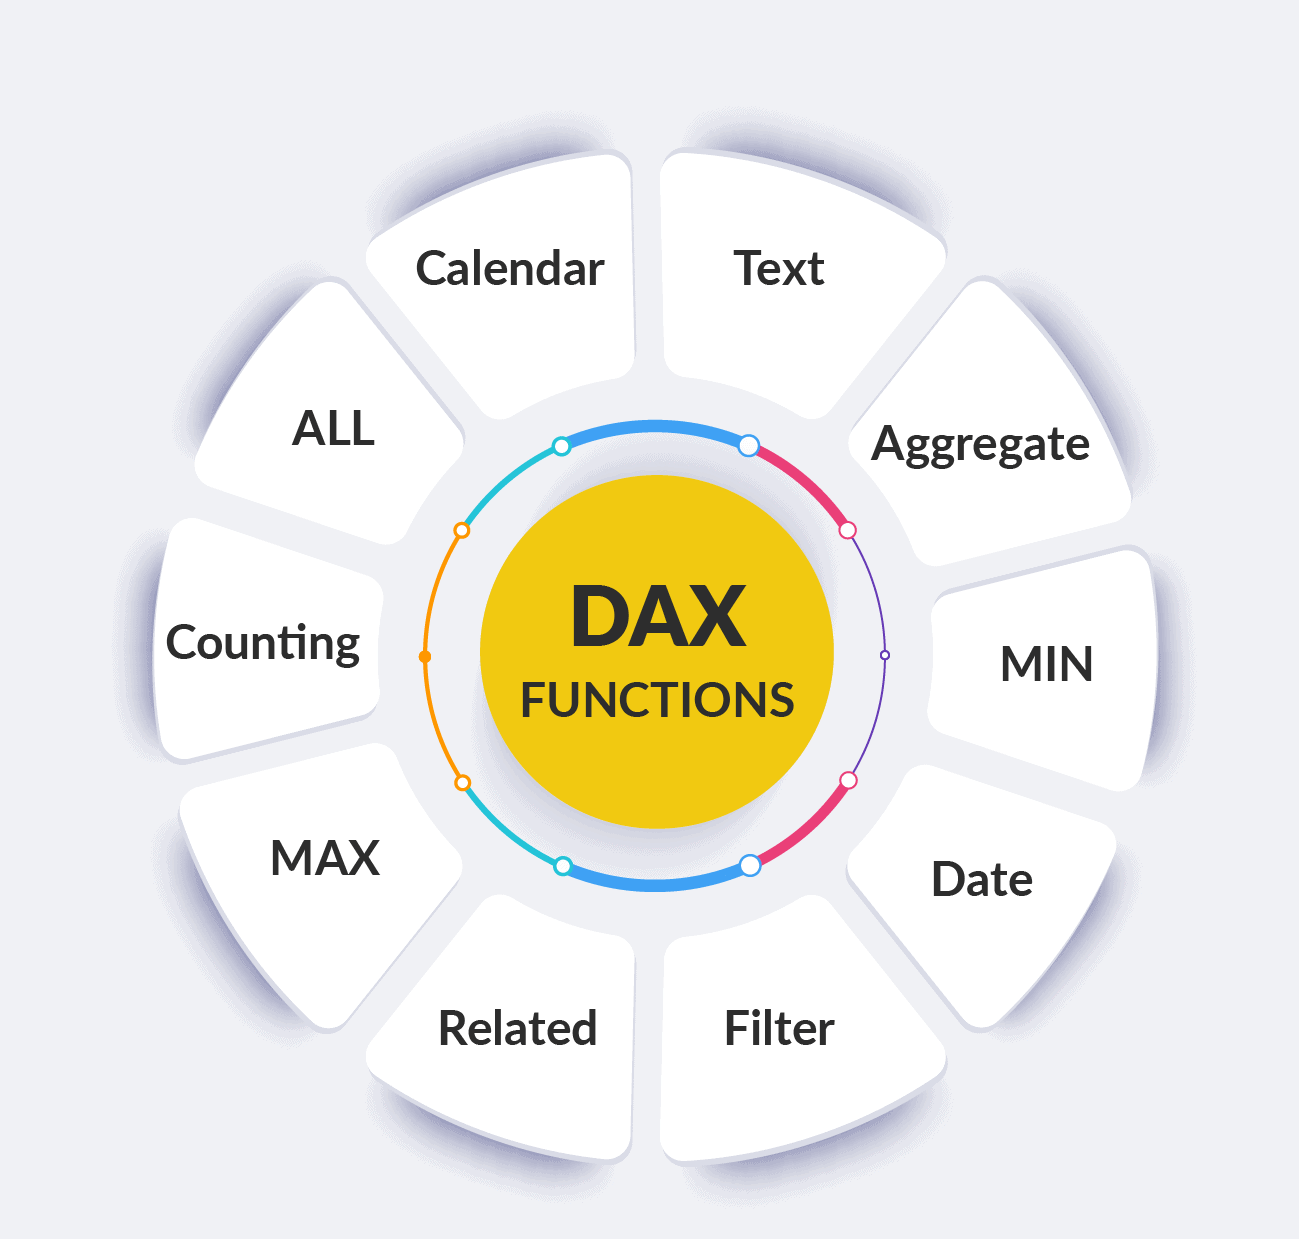
To do the data analysis and basic calculation on data in Power pivot, we use Data Analysis Expression (DAX). DAX (Data Analysis Expressions) is known as a functional language. It is a formula-based language used to compute calculated fields and calculated columns. Help create new information in the form of calculated columns and measures, tables from data already existing in your table.
- DAX(Data Analysis Expression) works on the column values.
- It cannot insert or modify data.
- Helps to measures with DAX and Create calculated columns.
Also Read: Our blog post on Power bi GateWay.
> Create a Custom Column
DAX allows you to augment the data that you bring in from different data sources by creating a calculated column that didn’t originally exist in the data source.
Three ways to create a custom column in Power BI are:
- Create the column in the source query when you get the data, for instance, by adding the calculation to a view in a relational database.
- Create a custom column in Power Query.
- Create a calculated column by using DAX in Power BI.
Check Out: What is a Slicer in Power bi.
> Create a Quick Measure
Calculated columns are useful when you are required to operate row by row. However, other situations might require a simpler method.
Consider a situation where you want an aggregation that operates over the entire dataset, and you want the total sales of all rows. Furthermore, you want to slice and dice that data by other criteria like total sales by year, by the employee, or by-product.
To accomplish those tasks, you would use a measure. You can build a measure without writing DAX code; Power BI will write it for you when creating a quick measure.
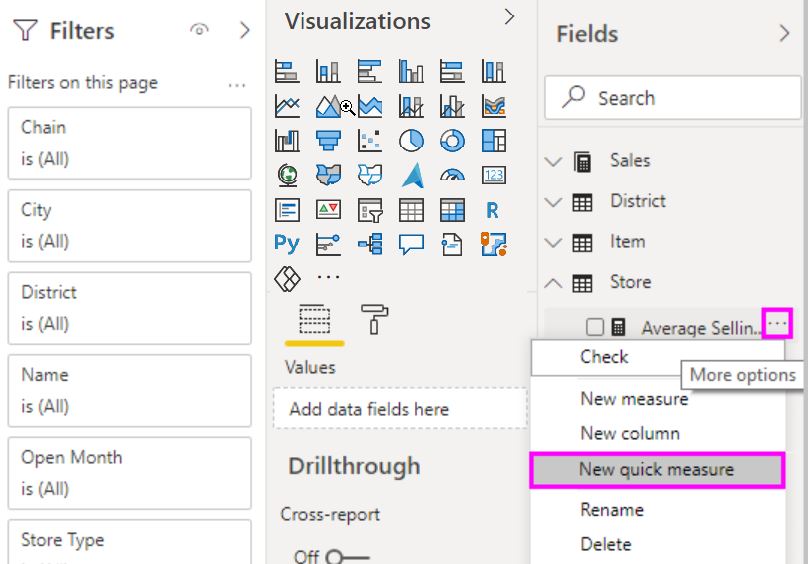
In the Quick measures window, you can select the calculation you want and the fields to run the calculation against. For instance, you can select a calculation and the column that you want to operate over.
Power BI creates the DAX measure for you and displays the DAX. This approach can be a helpful way to learn the DAX syntax.
Also Read: Our blog post on Power bi KPI.
> Understand context
The ensuing visuals will demonstrate how context affects DAX measures so you can see how they interact together.
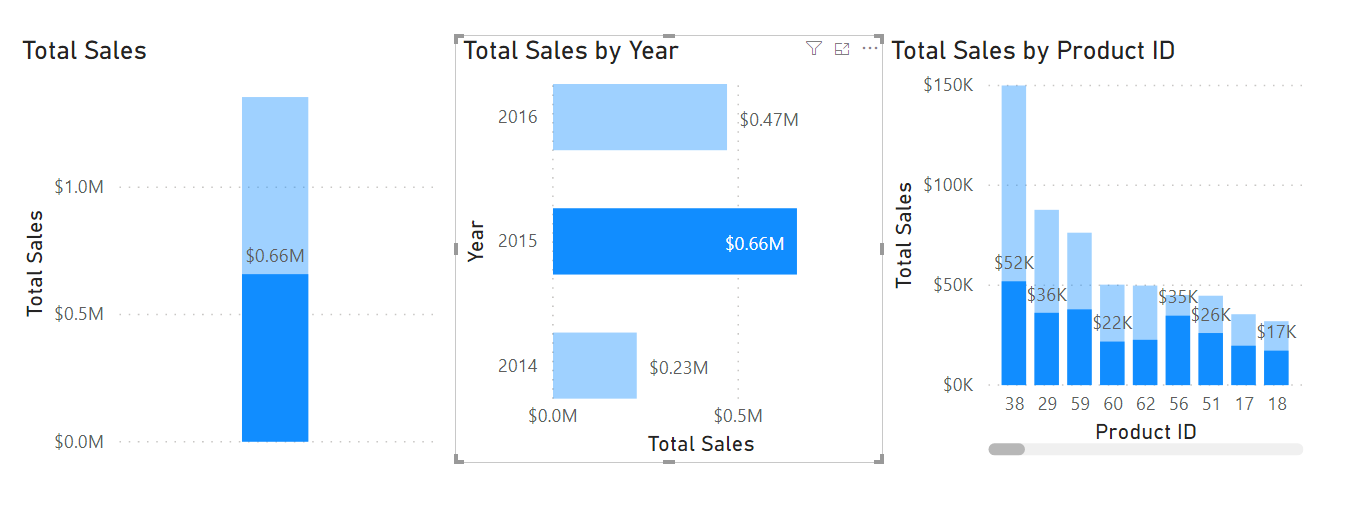
The following three visuals use the same DAX measure: Total Sales.

- Though each visual uses the same DAX measure and the same DAX formula, the visuals produce different results.
- The first visual shows the Total Sales measure for the entire dataset. In this dataset, Total Sales is USD1.35 million.
- In the second visual, Total Sales is broken down by year. For instance, in 2014, Total Sales is USD0.23 million. In the third visual, Total Sales is broken down by Product ID.
- Power BI, even though the measure was only defined once, can be used in these visuals in different ways.
- Each of the totals is accurate and performs quickly. It is the context of how the DAX measure is used that calculates these totals accurately.
If you select the second visual and then select 2015, the results appear in the following image.
- After selecting 2015, as shown in the above image, I changed the filter context for the DAX measure.
- It modified the first visual to equal the sales for 2015: USD0.66 million. It also broke down the Total Sales By Product ID but only showed the results for 2015.
- This scenario is a simple way to explain how context works with DAX.
Also Read: Our blog post on Power bi Developer.
> Create Semi-Additive Measures
- Semi-Additive measures are used when you don’t use the standard evaluation behavior in Power BI. Standard measures are simple concepts, where they might use the SUM, AVERAGE, MIN, and MAX functions.
- Occasionally, summing a measure doesn’t make sense, such as performing inventory counts in a warehouse.
- Take an example where if on Day 1, you have 100 mountain bikes, and on Day 2, you have 125 mountain bikes, you wouldn’t want to add those together to indicate that you had 225 mountain bikes between those two days.
- You can use the CALCULATE function to complete this action, along with the last date function
Also Read: Our blog post on App Power bi.
> Work with Time Intelligence
- All data analysts will have to deal with time. Dates are important, so we highly recommend that you create or import a dates table. This approach will help make date and time calculations much simpler in DAX.
- Sometimes Calculations are simple to do in DAX, and others are difficult. The following image shows what happens if you want to display a running total.
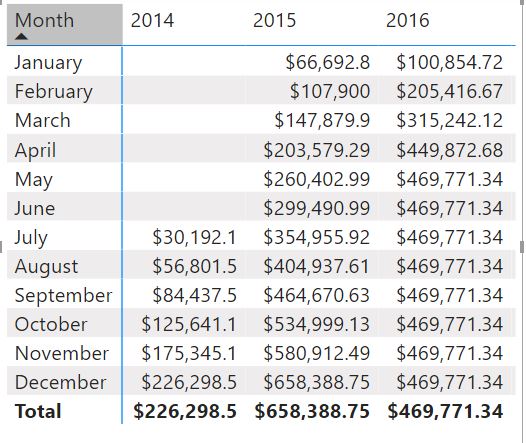
- The totals increment for each month but then reset when the year changes. DAX makes the process simple.
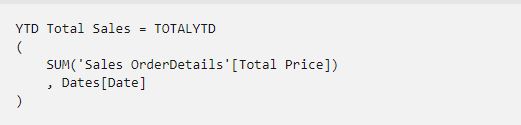
- In the below image, the YTD Total Sales measure uses a built-in DAX function called TOTALYTD. This function takes an argument for the type of calculation.
- You can use the SUM function to get the Total Price. The second argument that you want to operate over is the Dates field.
- You can use your Dates table and add this measure to your visuals, and you’ll get the running total result you’re looking for.
Also Read: SSRS vs Power bi, to know the major differences between them.
Q/A Asked in the session
Q1: What is DAX?
A. DAX is a collection of functions, operators, and constants used in an expression or formula to calculate and return more values. Stated more simply, DAX helps you to create new information from data already in your model.
Q2: Explain more about syntax?
A. 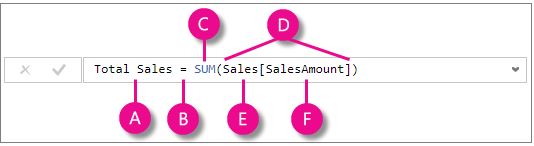
- Syntax includes the various elements that make up a formula, or more simply, how the formula is written. For example, here’s a simple DAX formula for a measure:
- The measure name, Total Sales.
- The equals sign operator (=), which indicates the beginning of the formula. When calculated, it will return a result.
- The DAX function SUM adds up all of the numbers in the Sales [SalesAmount] column. You’ll learn more about functions later.
- Parenthesis (), which surrounds an expression that contains one or more arguments. Most functions require at least one argument. An argument passes a value to a function.
- The referenced table, Sales.
- The referenced column, [SalesAmount], is in the Sales table. With this argument, the SUM function knows on which column to aggregate a SUM.
Q3: Explain DAX Data type?
A: In DAX, it is possible to define the data type for each column based on your requirement. Improve the performance when to refresh data and use of any report and the selection of the best data type helps to reduce the size of a data model.
Q4: What is the list of DAX Data types?
A: The List of DAX Data types are:
- Binary
- Boolean
- Currency
- DateTime
- Decimal
- Integer
- String
- Variant
Q5: What are the types of DAX operators?
A: DAX operators are divided into four categories:
- comparison operators
- arithmetic operators
- text operator
- logic operator
Q6: What is the difference between a calculated column and a measure?
A: The fundamental difference between a calculated column and a measure is:
- A calculated column creates a value for each row in a table.
- Calculated column values are stored in the Power BI .pbix file
- Each calculated column will increase the space used in that file and potentially increase the refresh time.
- Measures are calculated on demand.
- Measures do not add to the overall disk space of the Power BI .pbix file.
- Measures are calculated based on the filters that the report user uses. These filters combine to create the filter context.
Q7: What does a function always reference?
A: Table and a column.
Q8: Can a formula contain more than one function?
A: Yes. The formula can contain up to 64 nested functions.
Q9: What is filter context?
A: One or more filters in a calculation that determines a single value.
Q10: Why is DAX so important?
A: Learning how to create effective DAX formulas will help you to get the most out of your data. When you get the information you need, you can begin to solve the real business problems that affect your bottom line. This is the power of Dax, and Power Bi will help you get there.
Q11: Explain When Do You Use Sumx() Instead Of Sum()?
A: When the expressions to SUM() consists of whatever else than a column name.
Typically whilst you need to feature or multiply the values in extraordinary columns:
SUMX(Orderline, Orderline[quantity], Orderline[price])
SUMX() first creates a row context over the Sales table (see 1 above). It then iterates through this desk one row at a time. SUM() is optimized for lowering over column segments and is as such now not an iterator.
Q12: How Is Filter Context Propagated Through Relationships?
A: Filter context automatically propagates following the filtering of the connection. It usually propagates from the one facet of the connection to the numerous fact. No functions are available to pressure the propagation: Everything automatically occurs inside the engine, in step with the definition of relationships inside the information version.
Quiz Time (Sample Exam Questions)
With our Microsoft Data Analyst Associate, we cover Over 100+ Sample questions to help you prepare for the Certification [DA-100]
Check out these Questions:
Comment your answer in the comment box.
References
- Microsoft Certified Data Analyst Associate [DA100]: Everything You Need To Know
- Microsoft Certified Data Analyst Associate [DA100] Step By Step Activity Guides (Hands-On Labs)
- Introduction to DAX in Power BI
Next Steps to begin with DA100 Certification:
In our Microsoft Data Analyst Associate[DA-100] Certification Training Program, we will cover 11 Hands-On Labs. If you want to start the journey towards becoming a Microsoft Data Analyst Associate[DA-100], try our FREE CLASS.

Leave a Reply