

![]()
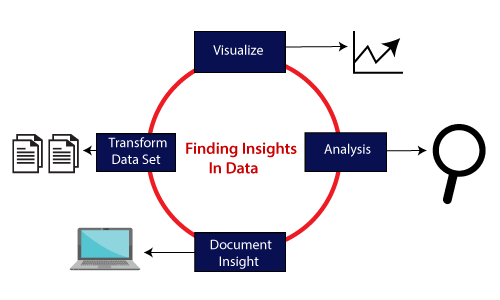
Data science is an interdisciplinary field that involves using scientific methods, processes, algorithms, and systems to extract knowledge and insights from structured and unstructured data.
It involves the use of techniques from statistics, computer science, and domain-specific knowledge to analyze and interpret data in order to make predictions, discover patterns, and gain insights. Data science is used in a wide range of industries, including healthcare, finance, marketing, and manufacturing, to make data-driven decisions and improve business outcomes.
This blog post helps you with your self-paced learning as well as with your team learning. There are many Hands-On Labs in this course.
Here’s a quick sneak-peak of how to start learning Data Science For Beginners by doing Hands-on.
 Module 1: Python for Data Science
 Module 1: Python for Data Science
1) Environment Setup: Install Jupyter Notebooks
There are two ways to Install the Jupyter Notebook.
1. Using the pip command
We can use pip to install Jupyter Notebook using the following command:
$ pip install jupyter
2. Anaconda
We can also use Anaconda, which is a Python data science platform. Anaconda has its own installer named conda that we can use to install Jupyter Notebook.
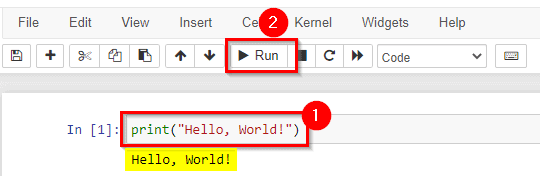
2) Try Jupyter Notebook: Hello World!
We can print anything in python jupyter notebook by using ‘print(” “)‘ Syntax.
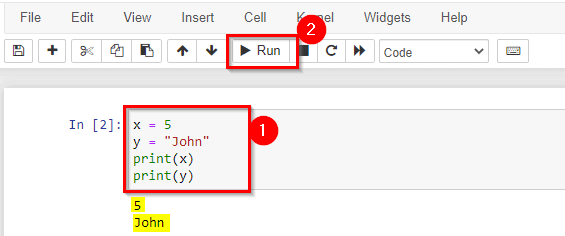
3) Working with Variables
Python has no command for declaring a variable. A variable is created the moment you first assign a value to it.
Python supports the usual logical conditions from mathematics:
- Equals: a == b
- Not Equals: a != b
- Less than: a < b
- Less than or equal to: a <= b
- Greater than: a > b
- Greater than or equal to: a >= b
These conditions can be used in several ways, most commonly in “if statements” and loops.
4) Understand the if-loop statement
An “if statement” is written by using the if keyword.
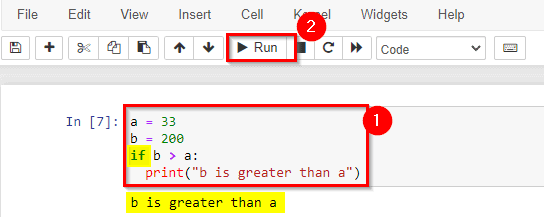
In this example, we use two variables, a and b, which are used as part of the if statement to test whether b is greater than a. As a is 33, and b is 200, we know that 200 is greater than 33, and so we print to screen that “b is greater than a“.
5) Understand For loop statement
A for loop is used for iterating over a sequence (that is either a list, a tuple, a dictionary, a set, or a string). This is less like the for a keyword in other programming languages and works more like an iterator method as found in other object-orientated programming languages. With the for loop we can execute a set of statements, once for each item in a list, tuple, set etc.
Print each fruit in a fruit list:
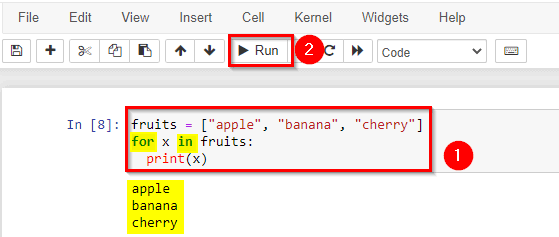
The for loop does not require an indexing variable to set beforehand.
6) Understand While loop statement
With the while loop we can execute a set of statements as long as a condition is true.
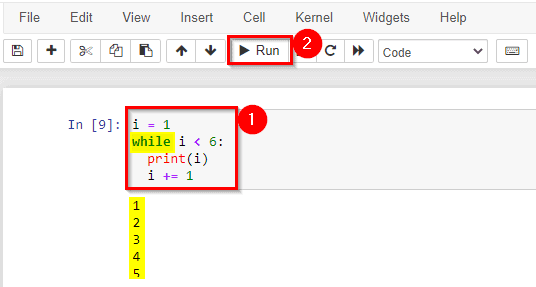
Note: remember to increment i, or else the loop will continue forever.
The while loop requires relevant variables to be ready, in this example, we need to define an indexing variable, i, which we set to 1.
Module 2: Operators and Keywords
1) Create & Work with Lists
Lists are one of 4 built-in data types in Python used to store collections of data. Lists are used to store multiple items in a single variable.
Lists are created using square[] brackets:
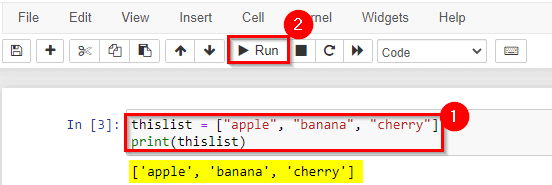
List items are ordered, changeable, and allow duplicate values. List items are indexed, the first item has index [0], the second item has index [1] etc.
2) Working with Tuples
Tuples are used to store multiple items in a single variable. A tuple is a collection that is ordered and unchangeable.
Tuples are written with round() brackets.
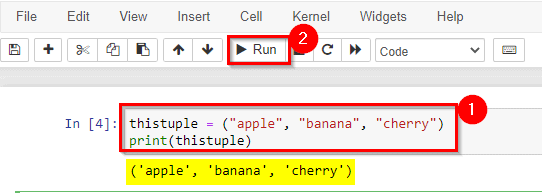
Tuple items allow duplicate values.
3) Sets & Exercises
Sets are used to store multiple items in a single variable. A set is a collection that is both unordered and unindexed.
Sets are written with curly{} brackets.
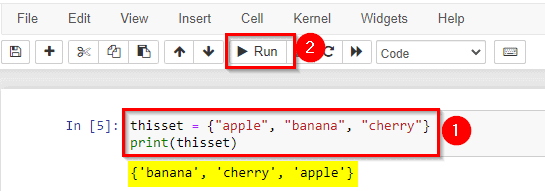
Set items are unordered, unchangeable, and do not allow duplicate values.
4) Create & Understand Dictionaries
Dictionaries are used to store data values in key: value pairs. A dictionary is a collection which is ordered, changeable and does not allow duplicates.
Dictionaries are written with curly brackets, and have keys and values:
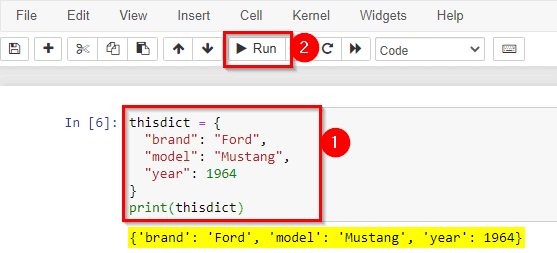
Dictionary items are presented in key: value pairs, and can be referred to by using the key name.
Module 3: NumPy & Pandas
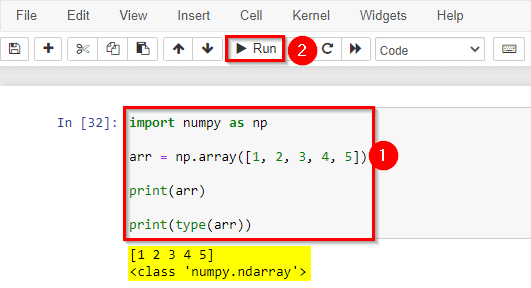
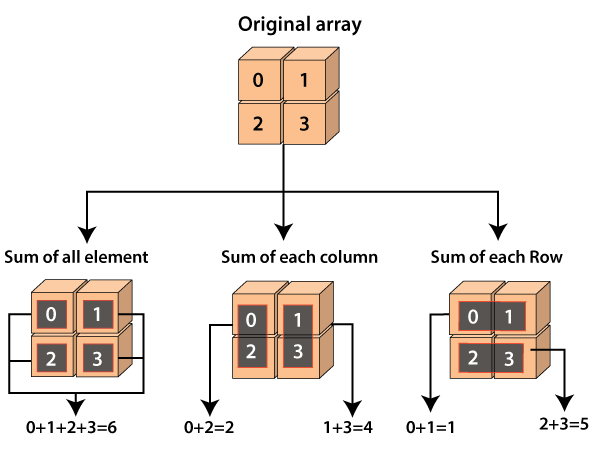
1) Create & work with NumPy Arrays
The array object in NumPy is called ndarray. We can create a NumPy ndarray object by using the array() function. NumPy is a Python library used for working with arrays.
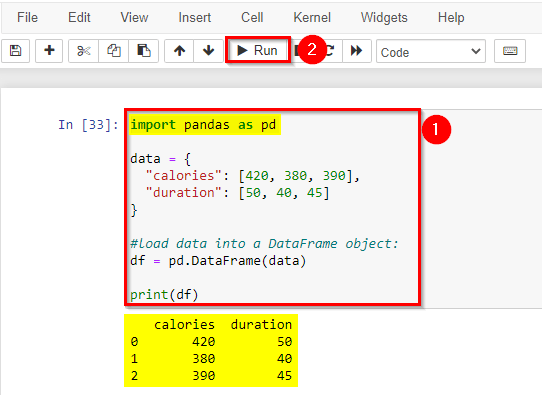
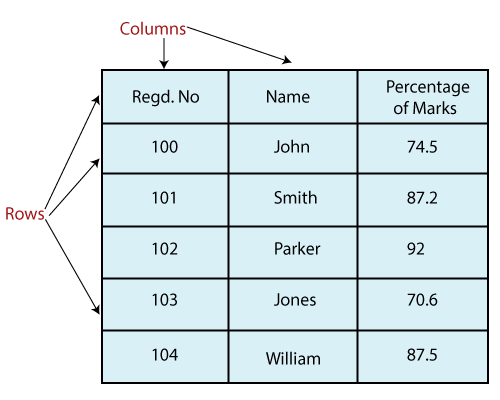
2) Create Pandas Dataframe
A Pandas DataFrame is a 2-dimensional data structure, like a 2-dimensional array, or a table with rows and columns.
Create a simple Pandas DataFrame:
3) Pandas Dataframe: load csv files
A simple way to store big data sets is to use CSV files (comma-separated files). CSV files contain plain text and are a good know format that can be read by everyone including Pandas. In our examples, we will be using a CSV file called ‘data.csv’.
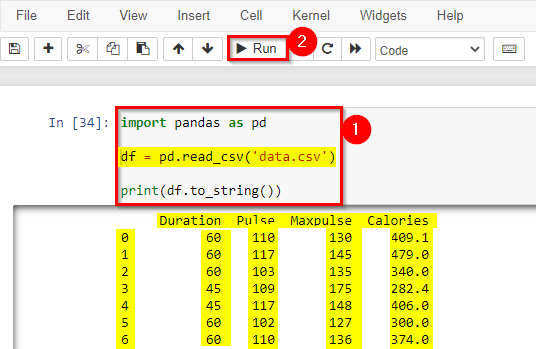
Tip: use to_string() to print the entire DataFrame.
Module 4: Function, Classes & Oops
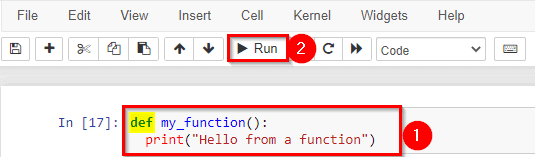
1) Working with User-defined Methods
A function is a block of code that only runs when it is called. You can pass data, known as parameters, into a function. A function can return data as a result.
In Python a function is defined using the def keyword:
2) Working with Inbuilt Methods
Inbuilt functions are functions that are already pre-defined. You just have to call the function and don’t worry about creating. In python there are many pre-defined functions, here we are gone pick one or two functions for understanding clearly.
- abs(): Returns the absolute value of the given number and returns a magnitude of a complex number.
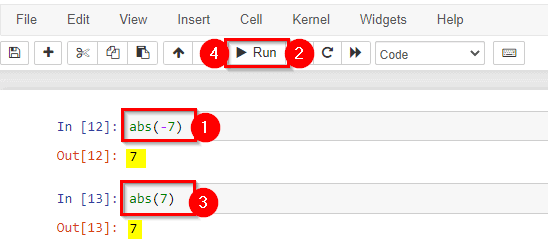
- chr(): This Built-In function returns the character in python for an ASCII value.
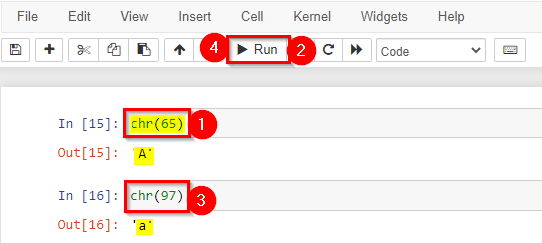
and there are many more built-in functions.
3) Implementing User-defined Functions (Create, Call)
User-defined functions are functions that you use to organize your code in the body of a policy. Once you define a function, you can call it in the same way as the built-in functions.
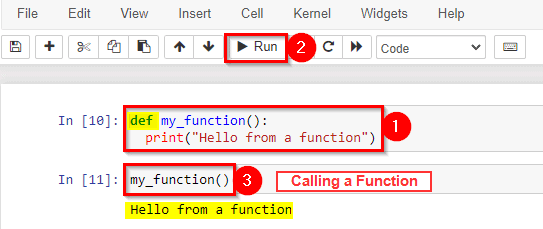
To call a function, use the function name followed by a parenthesis.
4) Implementing Inbuilt Functions
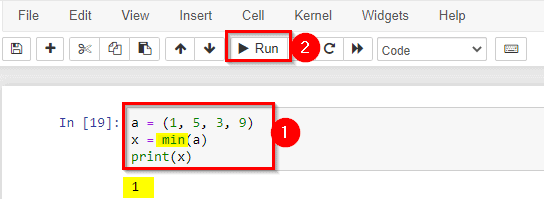
Here we gonna see some important inbuilt functions which we are gonna use frequently.
The min() function returns the item with the lowest value or the item with the lowest value in an iterable. If the values are strings, an alphabetical comparison is done.
Return the item in a tuple with the lowest value:
5) Create Classes & Objects in Python
A Class is like an object constructor or a “blueprint” for creating objects. To create a class, use the keyword class.
Create a class named MyClass, with a property named x:
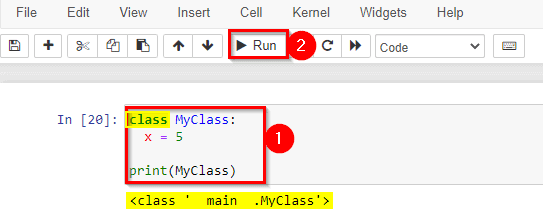
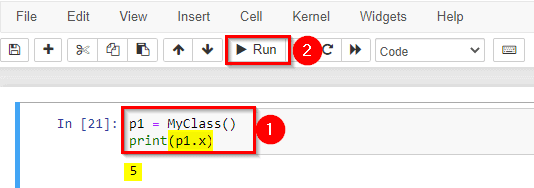
Now we can use the class named MyClass to create objects.
Create an object named p1, and print the value of x:
6) Understand the Inheritance Concept
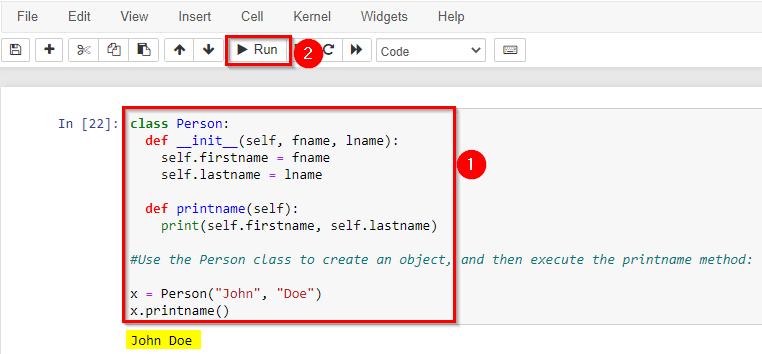
Inheritance allows us to define a class that inherits all the methods and properties from another class. The parent class is the class being inherited from, also called base class. A child class is a class that inherits from another class, also called a derived class. Any class can be a parent class, so the syntax is the same as creating any other class.
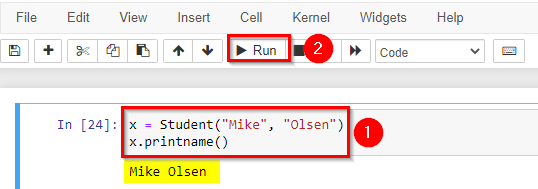
Create a class named Person, with first name and last name properties, and a print name method:
To create a class that inherits the functionality from another class, send the parent class as a parameter when creating the child class.
Create a class named Student, which will inherit the properties and methods from the Person class:
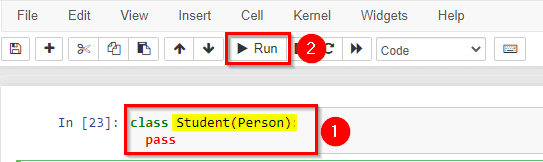
Note: Use the pass keyword when you do not want to add any other properties or methods to the class.
Now the Student class has the same properties and methods as the Person class.
Use the Student class to create an object, and then execute the print name method:
Module 5: Data Science essential Libraries
There are many libraries available for data science, but some of the most essential libraries include:
- NumPy: This library provides support for large, multi-dimensional arrays and matrices of numerical data, as well as a large collection of mathematical functions to operate on these arrays.

- Pandas: This library provides fast, flexible, and expressive data structures designed to make working with “relational” or “labeled” data both easy and intuitive. It is a must-have for data cleaning, transformation, and manipulation.

- Matplotlib: This library is a plotting library for the Python programming language and its numerical mathematics extension NumPy. It provides an object-oriented API for embedding plots into applications using general-purpose GUI toolkits like Tkinter, wxPython, Qt, or GTK.

- Scikit-learn: This library is a machine learning library for the Python programming language. It features various classification, regression and clustering algorithms including support vector machines, random forests, gradient boosting, k-means, etc.

- TensorFlow or PyTorch: These are open-source machine learning libraries that allow you to build and train neural networks. TensorFlow is developed by Google and PyTorch is developed by Facebook.

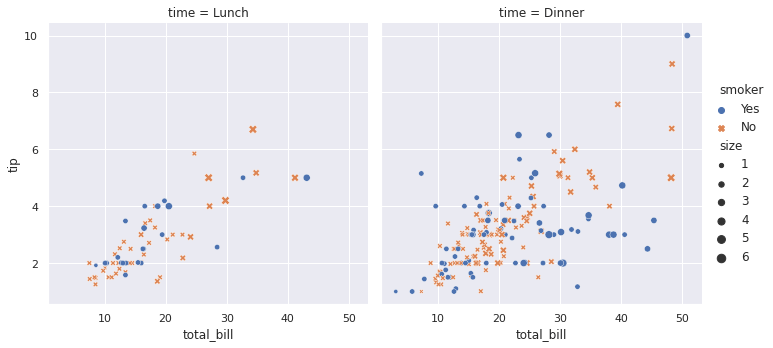
- Seaborn: This library is a data visualization library based on matplotlib. It provides a high-level interface for drawing attractive and informative statistical graphics.

- Plotly is a charting library that comes with over 40 chart types, 3D charts, statistical graphs, and SVG maps.
which includes:- Scatter Plots
- Line Graphs
- Linear Graphs
- Multiple Lines
- Bar Charts
- Horizontal Bar Charts
- Pie Charts
- Donut Charts
- Plotting Equations

These libraries are widely used in the data science community and provide a solid foundation for many data science tasks. However, depending on the specific problem or task, other libraries may also be useful, such as NLTK for natural language processing or StatsModels for statistical modeling
Module 6: SQL Course Content
SQL (Structured Query Language) is a standard programming language used to manage and manipulate relational databases. Here are some common SQL commands that are used to work with databases:
- SELECT: This command is used to retrieve data from a database table. The SELECT statement is used to select columns from a table and can include a WHERE clause to filter the data.
SELECT column1, column2, ...
FROM table_name;
- INSERT: This command is used to insert data into a table. The INSERT statement is used to insert data into a table and can include values for specific columns.
INSERT INTO table_name
VALUES (value1, value2, value3, ...);
- UPDATE: This command is used to update data in a table. The UPDATE statement is used to update data in a table and can include a WHERE clause to filter the data.
UPDATE table_name
SET column1 = value1, column2 = value2, ...
WHERE condition;
- DELETE: This command is used to delete data from a table. The DELETE statement is used to delete data from a table and can include a WHERE clause to filter the data.
DELETE FROM table_name WHERE condition;
- CREATE: This command is used to create a new table, database, or other database objects. The CREATE statement is used to create a new table, database, or other database object and can include specifications for columns and data types.
CREATE TABLE table_name ( column1 datatype, column2 datatype, column3 datatype, .... ); - ALTER: This command is used to modify the structure of a table, such as adding or dropping columns.
ALTER TABLE table_name
ADD column_name datatype;
- JOIN: This command is used to combine rows from two or more tables based on a related column between them.
SELECT *
FROM Orders
LEFT JOIN Customers
Orders.CustomerID=Customers.CustomerID
- INDEX: This command is used to create and retrieve data from the indexes on one or more columns of a table, to improve the query performance.
CREATE INDEX index_name
ON table_name (column1, column2, ...);
- GROUP BY: This command is used to group rows that have the same value in a specified column, and to apply aggregate functions on them.
SELECT column_name(s)
FROM table_name
WHERE condition
GROUP BY column_name(s)
ORDER BY column_name(s);
- ORDER BY: This command is used to sort the result set in ascending or descending order based on one or more columns.
SELECT column1, column2, ...
FROM table_name
ORDER BY column1, column2, ... ASC|DESC;
SQL commands are used to manage and manipulate relational databases, it is important to note that different database management systems (DBMS) such as MySQL, PostgreSQL, SQLite, and Oracle, have their specific syntax for SQL commands.
Module 7: Statistics Essential for Data Science
Statistics is a fundamental part of data science, and a strong understanding of statistics is essential for effectively analyzing and interpreting data. Some of the key statistical concepts that are important for data science include:
- Descriptive statistics: This includes measures such as mean, median, mode, standard deviation, and variance, which are used to summarize and describe the main features of a dataset.
- Probability: This includes concepts such as random variables, probability distributions, and probability density functions, which are used to model and understand uncertainty in data.
- Linear regression: This is a statistical method used to model the relationship between a dependent variable and one or more independent variables.
- Bayesian statistics: This is a branch of statistics that provides a framework for modeling uncertainty and updating beliefs based on new data.
- Hypothesis testing: This is a statistical method used to test a claim about a population based on a sample of data
- Sampling: This includes techniques for selecting a representative subset of a population, such as random sampling and stratified sampling.
Data science is an interdisciplinary field that requires a combination of knowledge of statistics, computer science, and domain-specific knowledge to work with data, so it is important to have a strong foundation in statistics to be able to understand, analyze and interpret data.
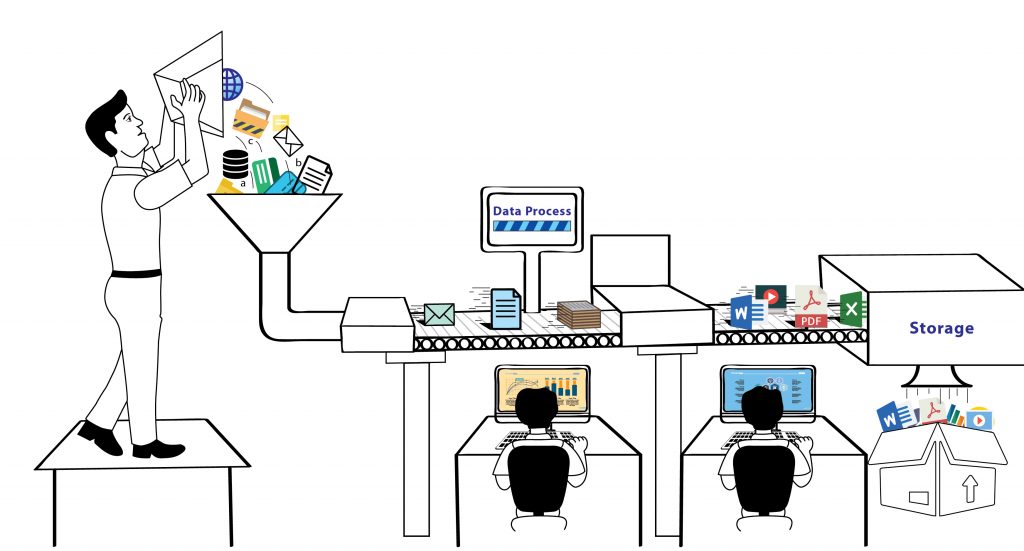
Module 8: Data Pre-processing
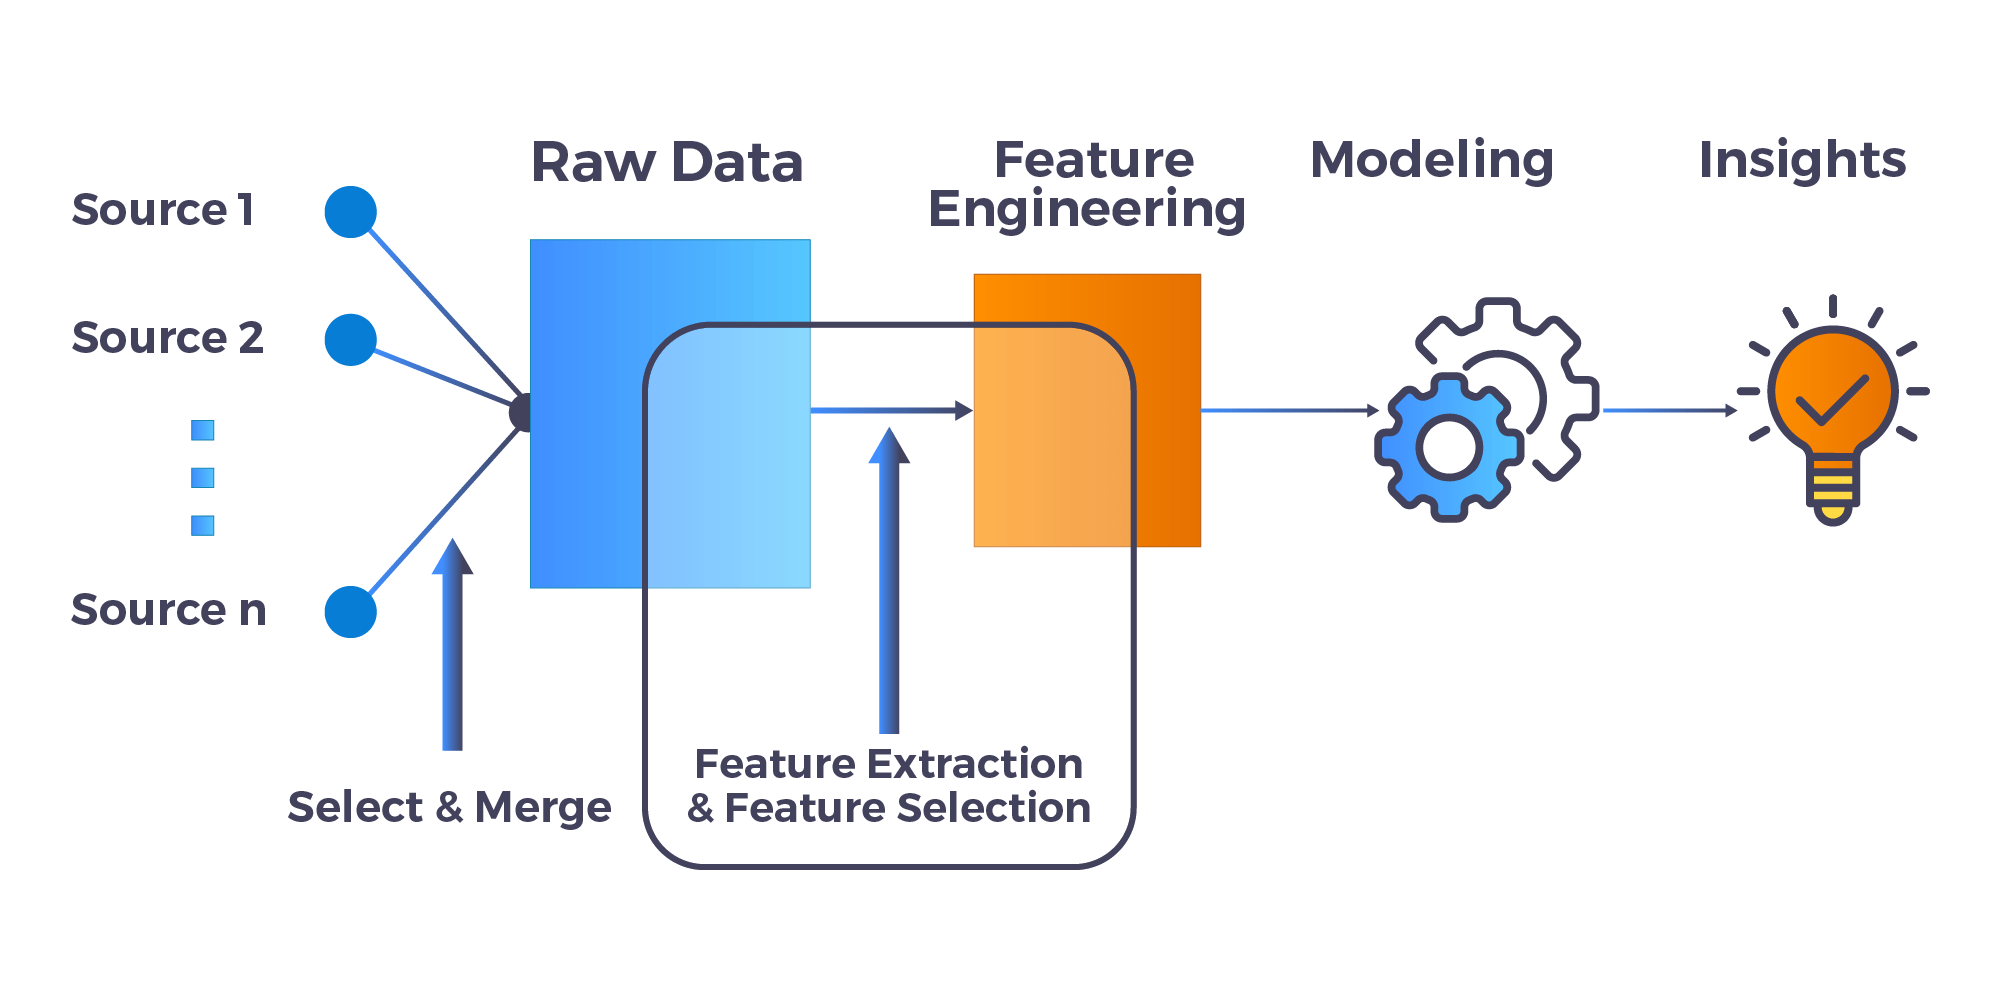
1) Data Pre-Processing
In any Data Science and Machine Learning process, Data Preprocessing is the step in which the data gets converted, or Encoded, to bring it to such a state that now the machine can simply interpret it. In other words, the features of the data can now be simply interpreted by the algorithm.
A feature is an individual measurable characteristic or property of a phenomenon being observed. Features can be:
- Categorical
- Numerical
In this lab, we will learn the following steps to achieve our goal of Data pre-processing.
- Read the default directory name.
- Concatenate the directory with files.
- Use concatenated string to read a .csv file using a panda data frame.
- Identify categorical variables.
- Convert those variables into the category.
- Show the dimension and basic stat of the data set.
2) Missing value
In real-time scenarios data is often taken from various sources which are normally not too reliable and that too in diverse formats, more than half our time is expended in dealing with data quality issues when working on Data Science problems.
It is very much expected to have missing values in your dataset. It may have taken place during data collection, or maybe due to some data validation rule, but regardless missing values must be taken into the study.
To eliminate and estimate missing data, we will learn the following methods:
- Find the column-wise number of missing values.
- Convert into percentage terms.
- Print missing value count.
- Draw the graph showing the missing value count.
- Try out various libraries and packages.
- Identify columns automatically with missing value percentages greater than 30% and Drop those columns.
- Impute missing values by mean/median/most frequent technique.
- Do not impute the missing value of categorical variables.

3) Feature Engineering, Encoding, And Scaling Of Data
Feature Engineering is mostly performing transformations on the data such that it can be simply accepted as input for data science and machine learning algorithms while still keeping its original meaning.
Feature Encoding is the process of Conversion of a categorical variable to numerical features. There are many encoding techniques used for feature engineering:
- Label Encoding
- Ordinal encoding
- Frequency encoding
- Binary encoding
- One hot encoding
- Target Mean encoding
In this lab, we will learn the following techniques:
- Create additional columns based on existing columns
- Encode categorical variables using
- Ordinal encoder
- target encoding
- Scale numeric columns of the data frame
Module 9: Machine Learning – Regression
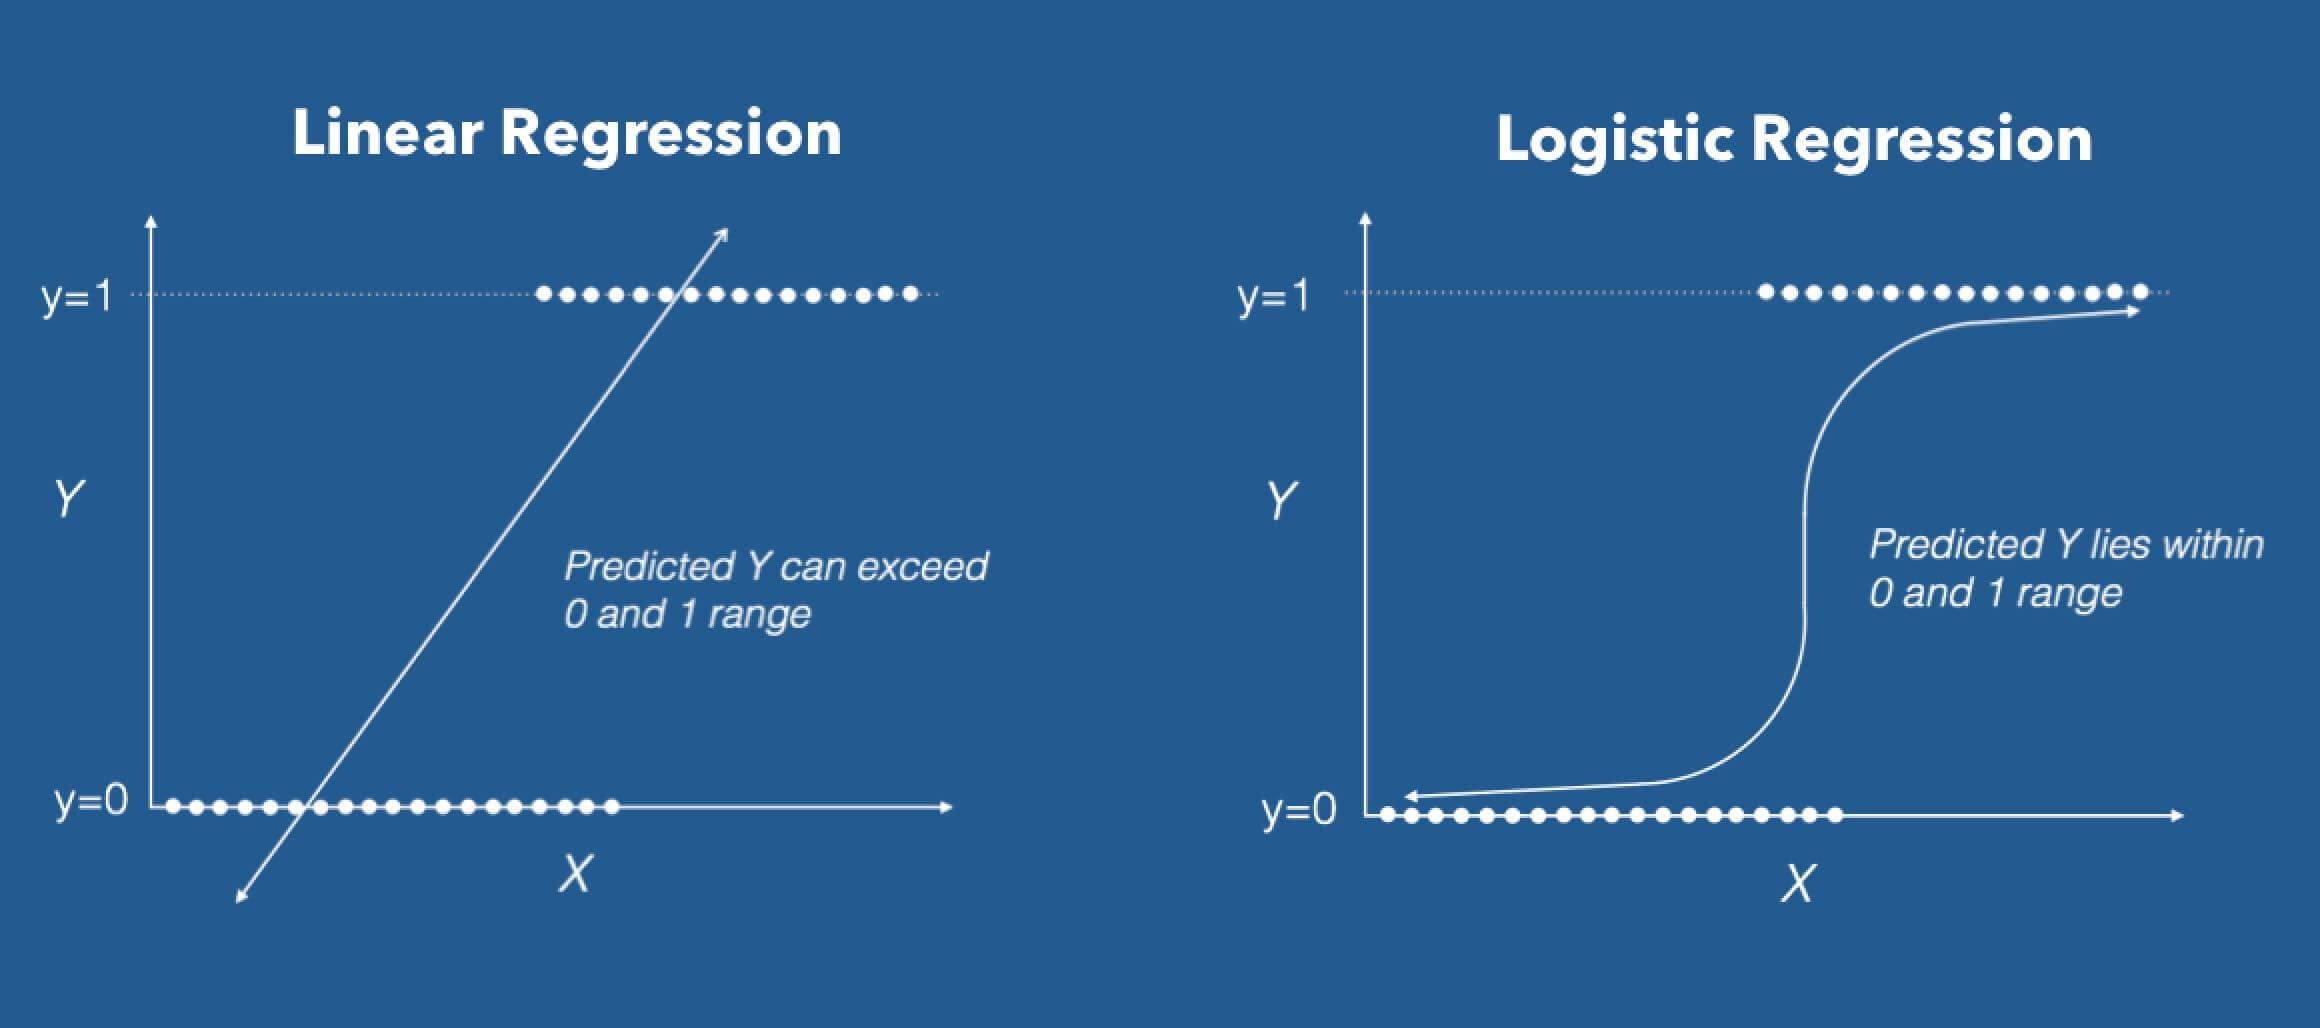
To implement a relationship between the independent and dependent variables of a given dataset we use Regression. It is a statistical tool. However, when we used the Linear Regression algorithm, we consider a linear relationship between one independent and one dependent variable. when the dependent variable(target) is categorical we used Logistic Regression.
In this lab, we will learn the following regression techniques:
- Linear regression
- Logistic regression
- Regularization
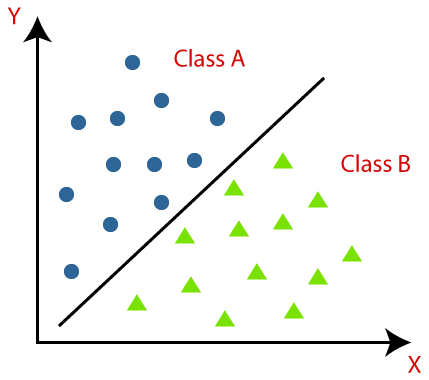
Module 10: Machine Learning – Classification
Classification is a type of supervised machine learning where the goal is to predict a discrete label or class for a given input data. Some common classification algorithms include:
- Logistic Regression: This is a simple and efficient algorithm that is used for binary classification (i.e. when there are only two possible classes). It uses a logistic function to model the probability of a sample belonging to a particular class.

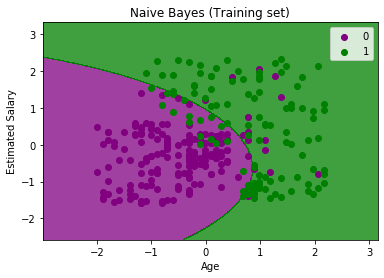
- Naive Bayes: This is a probabilistic algorithm that makes class predictions based on the probability of a given input data belonging to each class. It is based on the Bayes’ theorem and the assumption of independence between features.

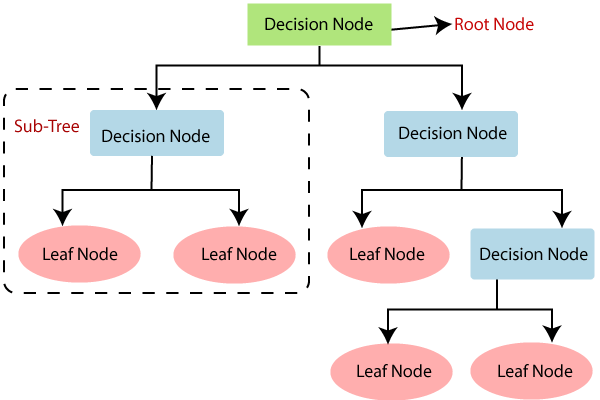
- Decision Trees: This algorithm builds a tree-like model of decisions and their possible consequences, which can be used for classification or regression. It is simple to understand and interpret and can handle both numerical and categorical data.
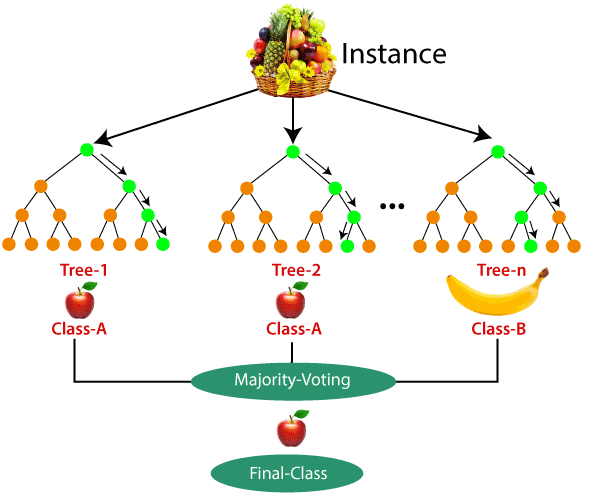
- Random Forest: This is an ensemble method that combines multiple decision trees to improve the overall performance and stability of the model. It is often used for large datasets and high-dimensional problems.

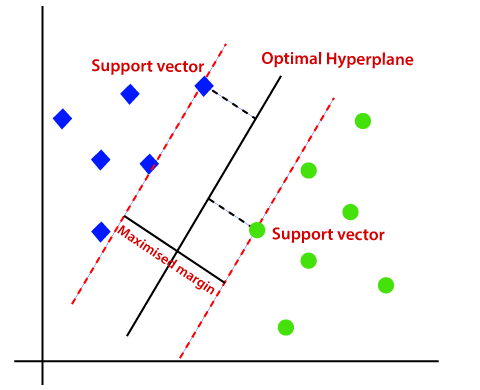
- Support Vector Machines (SVMs): This is a powerful algorithm that finds the best boundary (or “hyperplane”) to separate different classes. It is effective in high-dimensional spaces and can handle non-linearly separable data using the “kernel trick”.

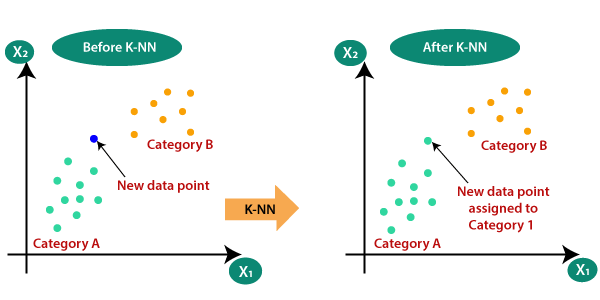
- k-Nearest Neighbors (k-NN): This algorithm classifies data points based on the majority class of their k nearest neighbors. It is simple to implement and can handle multi-class problems, but it can be sensitive to the choice of k and the distance metric used.

These are some of the most widely used classification algorithms, each one has its own strengths and weaknesses, and the best algorithm for a particular problem will depend on the specific characteristics of the data and the problem at hand.
Module 11: Machine Learning – Clustering
Clustering is a technique in machine learning that groups similar data points together. There are several popular clustering algorithms, including:
- K-Means: This is a simple and widely used algorithm that partitions a dataset into k clusters, where k is a user-specified parameter.
- Hierarchical Clustering: This algorithm groups data points into a hierarchical tree structure, where each group (or “cluster”) is a subset of the next higher level group.

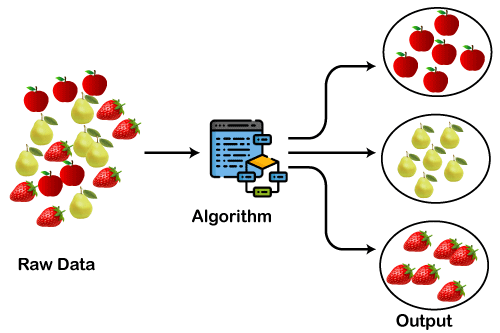
The choice of algorithm will depend on the specific characteristics of your dataset and the requirements of your application.
Module 12: Machine Learning – Association Rule Learning
Association rule learning is a technique in machine learning that is used to discover relationships between variables in a dataset. A commonly used algorithm for association rule learning is the Apriori algorithm.
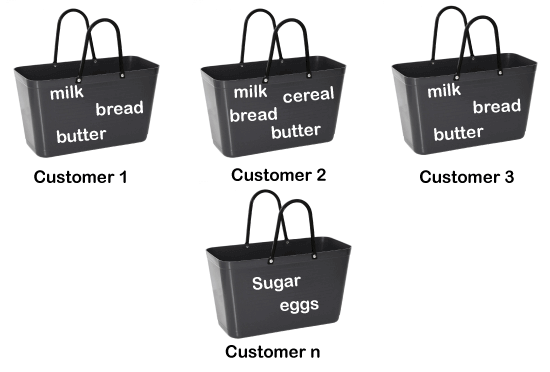
The Apriori algorithm is an unsupervised learning algorithm that generates association rules from a dataset of transactions. It uses the concept of “support” and “confidence” to determine which rules to keep. Support is a measure of how often an item set appears in the dataset, and confidence is a measure of how often the rule holds true.
Apriori is one of the most widely used algorithms for Association rule learning, but there are other options like FP-Growth, ECLAT, and many more. The choice of algorithm will depend on the specific characteristics of your dataset and the requirements of your application.
Module 13: Machine Learning – Reinforcement Learning
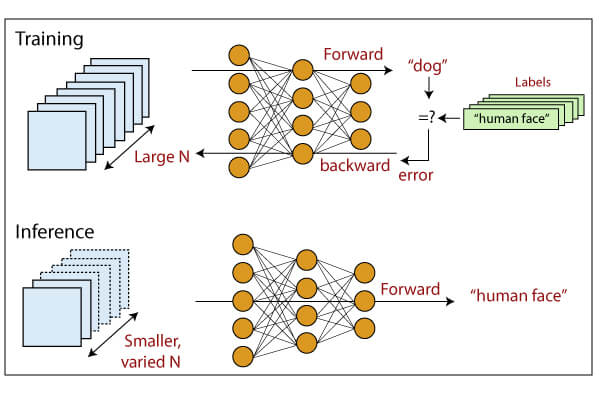
Reinforcement learning is a type of machine learning where an agent learns by interacting with an environment and receiving rewards or penalties for certain actions.
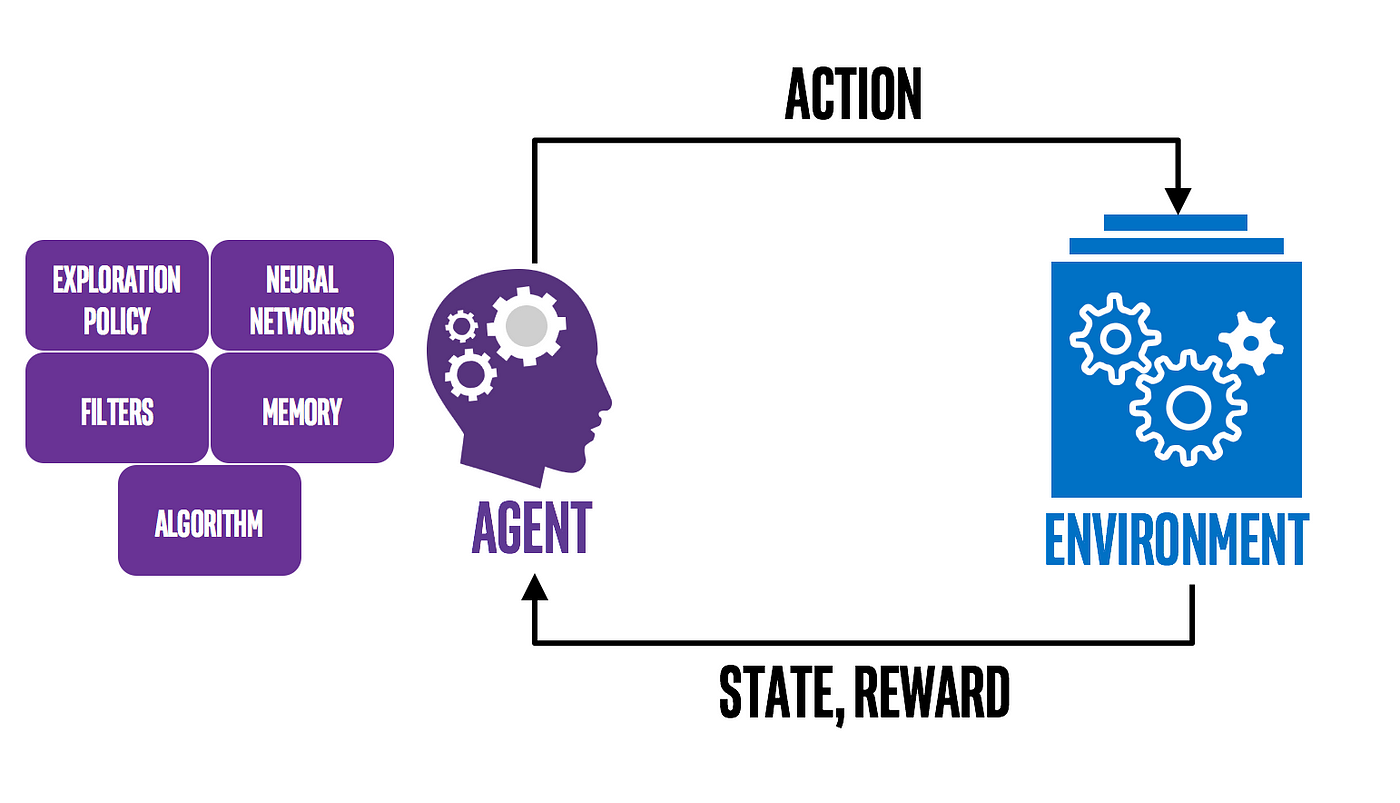
Two popular algorithms used in reinforcement learning are Upper Confidence Bound (UCB) and Thompson Sampling (TS).
Upper Confidence Bound (UCB) is a multi-armed bandit algorithm that balances exploration and exploitation. The agent uses the UCB formula to calculate an upper confidence bound for each action and selects the action with the highest bound. This allows the agent to explore new actions while still exploiting the knowledge it has gained about the best actions.
Thompson Sampling (TS) is a Bayesian algorithm that models the uncertainty of the agent’s beliefs about the environment. The agent samples from the posterior distributions of the rewards for each action and selects the action with the highest sample. This allows the agent to balance exploration and exploitation by taking into account its uncertainty about the environment.
Module 14: Machine Learning – Natural Language Processing
Bag-of-words is a widely used model in natural language processing (NLP) that represents text as a “bag” or a set of the words it contains, disregarding grammar and word order but keeping track of the frequency of each word.
The bag-of-words model is a simple and efficient way to represent text data for many NLP tasks such as text classification, text similarity, and language modeling.
![]()
Some popular algorithms used in NLP with the Bag-of-words model are:
- CountVectorizer: This algorithm converts a collection of text documents to a matrix of token counts. It is often used as a preprocessing step for other NLP algorithms such as Latent Semantic Analysis (LSA) and Latent Dirichlet Allocation (LDA).
- TF-IDF (Term Frequency-Inverse Document Frequency): This algorithm is a measure of the importance of a word in a document, which takes into account both the frequency of the word in the document and the frequency of the word in the entire corpus of documents. It is often used to weigh the importance of words in text classification, text similarity, and information retrieval.
- N-grams: An n-gram is a contiguous sequence of n items from a given sample of text or speech. N-grams are often used in natural language processing as a way to extract features from text data and can be represented as a bag of words.
- Word2Vec: This algorithm is a neural network-based technique for learning vector representations of words, also known as “word embeddings”. It can be used to find semantically similar words and is also used as a feature in other NLP tasks.
- FastText: It is similar to word2vec, but it uses subword information and can be used to classify texts into predefined categories.
These are some of the most popular algorithms used in natural language processing, but there are many more options available depending on the specific NLP task and the requirements of your application.
Module 15: Machine Learning – Dimensionality Reduction
Dimensionality reduction is a technique in machine learning that is used to reduce the number of features in a dataset while retaining as much information as possible. There are several popular dimensionality reduction algorithms, including:
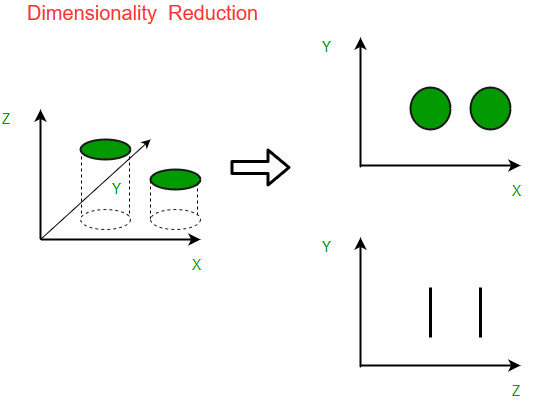
- Principal Component Analysis (PCA): PCA is a linear dimensionality reduction technique that projects the data onto a lower-dimensional subspace, where the new axes are the principal components of the data. The principal components are the directions of maximum variance in the data and are chosen such that they are orthogonal to each other.
- Linear Discriminant Analysis (LDA): LDA is a supervised dimensionality reduction technique that is used to project the data onto a lower-dimensional subspace that maximizes the separation between different classes. It works by finding the linear combinations of the features that best explain the variation between classes.
- Kernel PCA: Kernel PCA is a non-linear dimensionality reduction technique that maps the data into a higher-dimensional space using a kernel function, and then applies PCA to the mapped data. This allows for non-linear patterns in the data to be captured, which may not be possible using linear techniques like PCA.
PCA and LDA are the most basic and widely used algorithms for dimensionality reduction. Kernel PCA is used in cases where the data is non-linearly separable in the original feature space, and it can be used as a preprocessing step before other algorithms like SVM, KNN, etc.
Module 16: Machine Learning – Model Selection and Boosting
Model selection and boosting are techniques used in machine learning to improve the performance of a model.
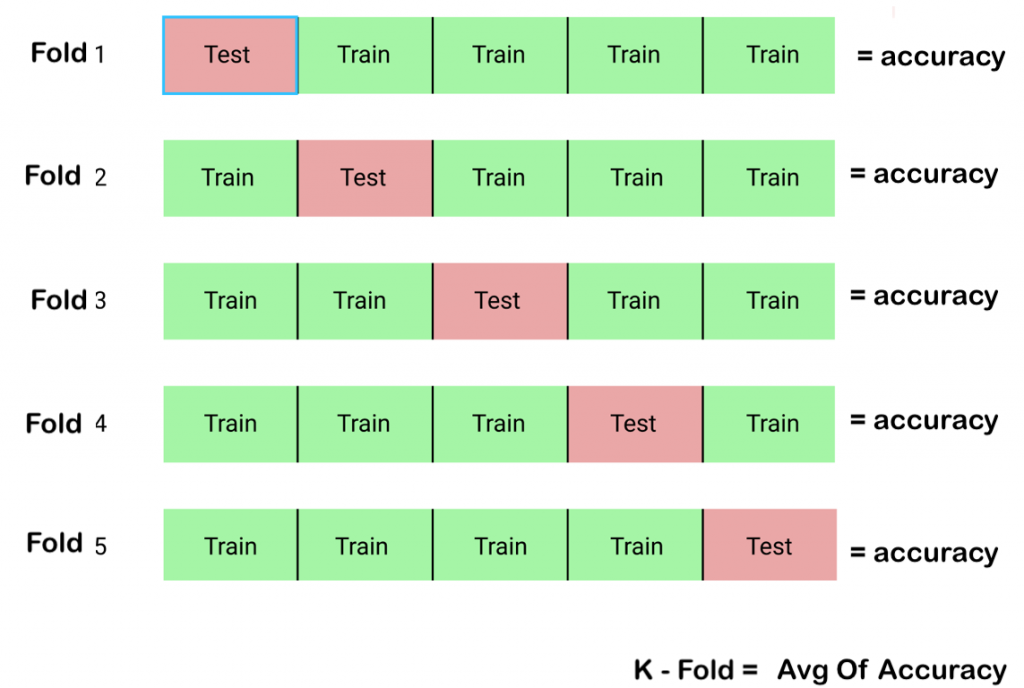
- k-fold Cross Validation: k-fold cross-validation is a technique used to evaluate the performance of a model by dividing the data into k partitions or “folds”, and training the model on k-1 of the folds while evaluating it on the remaining fold. This process is repeated k times, with a different fold used for evaluation each time, and the results are averaged to give an estimate of the model’s performance.
- Parameter tuning: Parameter tuning is the process of finding the optimal values for the parameters of a model, so that it performs well on the given task. This can be done manually or by using techniques such as grid search or random search.
- Grid Search: Grid search is a technique used to find the optimal values for the parameters of a model by specifying a range of possible values for each parameter and training the model with all possible combinations of parameter values.
- XGBoost: XGBoost (eXtreme Gradient Boosting) is a powerful and widely used machine learning algorithm that is particularly well suited for working with structured data, such as tabular data in databases or CSV files. It is an implementation of gradient boosting that is known for its speed and performance.
Related References
- Python For Beginners: Overview, Features & Career Opportunities
- An Introduction To Python For Microsoft Azure Data Scientist | DP-100
- Python For Beginners: Overview, Features & Career Opportunities
- Python For Data Science: Why, How & Libraries Used
- Working with Jupyter Notebook
- Introduction to Artificial Neural Network in Python
- Natural Language Processing with Python
- Data Scientists vs Data Engineers vs Data Analysts
Next Task For You…
Python’s growth is very promising in the near future. Gaining the right skills through the right platform will get you to the perfect job.
We are launching our course Complete Data Science Bootcamp (For Beginners) which will you help and guide you toward your first steps to Learning. Register for our FREE CLASS to know more about it.


![AWS DevOps [DOP-C02] Professional Step By Step Activity Guides (Hands-On Labs)](https://k21academy.com/wp-content/uploads/2023/02/DOP-C02-1.png)