


![]()
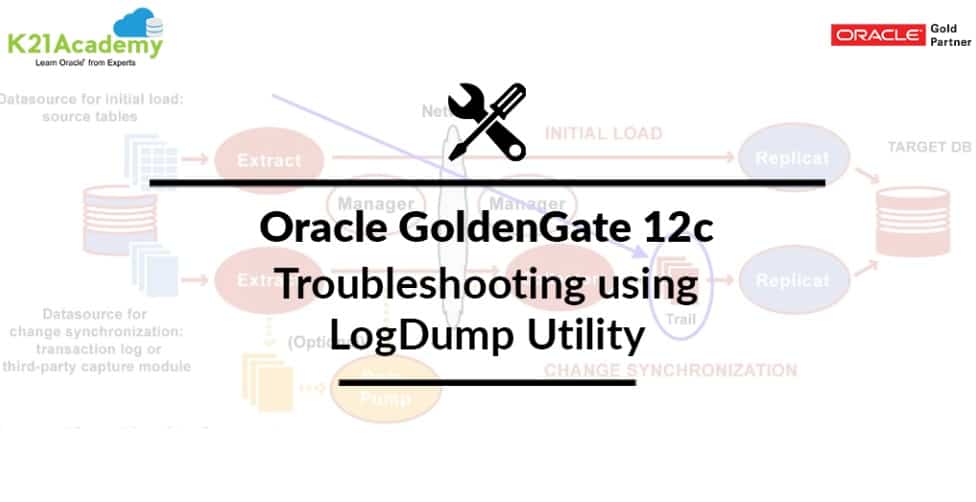
This post covers Troubleshooting using LogDump Utility of Oracle GoldenGate 12c (12.2.0.1.1)
Oracle Goldengate is a software for real-time data integration and replication in heterogeneous IT Systems.
If you are new to Oracle GoldenGate then check my previous posts about and Oracle GoldenGate 12c Overview & Components and Oracle GoldenGate 12c Download & Installation
What are Trail Files?
Extract Process (GoldenGate Component) all operations in each committed transactions in a file called as Trail File.
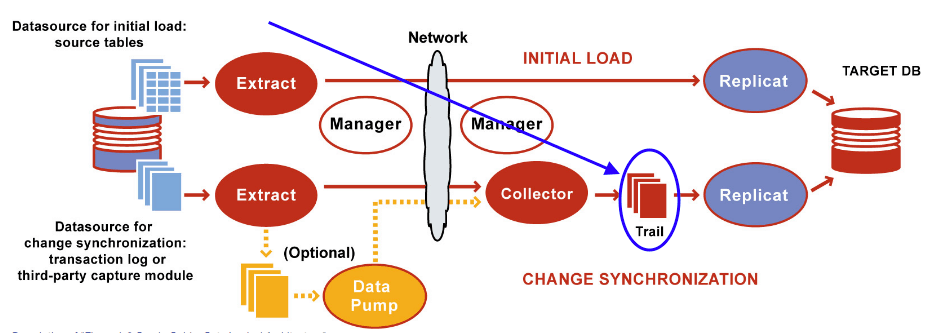
Logdump Utility
Oracle GoldenGate Software includes the Logdump Utility for viewing data directly from the trail files.
Without the Logdump, it is not possible to read the content of the Oracle GoldenGate trail files, as the trail files are in a binary format. With Logdump, we can open up the trail file, read its content, navigate through the file, view transactions at different RBA’s (relative byte address – file position), help identify the type of commands (DML or DDL) issued on the source, including delete, insert, update, alter and create statements.
Hence Logdump Utility is most important utility in troubleshooting GoldenGate Issues.
To invoke the utility, go to the GoldenGate home directory and type “logdump”, as shown in the following example.
[oracle@dbserver1 ggs]$ ./logdump
LogDump Commands:
1. How to open LogDump: Navigate to the directory where the Oracle GoldenGate Software is installed and execute the Logdump.
[GoldenGate]$ $GG_HOME/logdump
2. Opening a Trail File: To open a trail file and read its content, specify the trail file at the logdump prompt. Trail files are usually found in the GoldenGate dirdat directory.
$ ls -lrt
$GG_HOME/dirdat
$-rw-rw-rw- 1 oracle oinstall 78325 Dec 7 10:38 EE000001
$-rw-rw-rw- 1 oracle oinstall 78325 Dec 7 10:42 EE000002
$-rw-rw-rw- 1 oracle oinstall 78325 Dec 7 10:55 EE000003
You can also determine the current trail file directory/name by running the “INFO process_name” command at the ggsci prompt.
3. Open and view the details of local trail file:
Logdump> OPEN ./dirdat/EE000001
Change the file name and location as required.
4. Set Output Format: Enable the following options so that you are able to view the results in a readable format in your Logdump session.
a) Set trail file header details on: The FILEHEADER contains the header details of the currently opened trail file.
Logdump> FILEHEADER DETAIL
b) Record Header:
Logdump> GHDR ON
c) Set Column Details on: It displays the list of columns, their ID, length, Hex values etc.
Logdump> DETAIL ON
d) User Token Details: User token is the user-defined information stored in a trail, associated with the table mapping statements. The CSN (SCN in Oracle Database) associated with the transaction is available in this section.
Logdump> USERTOKEN DETAIL
e) Set length of the record to be displayed: In this case, it is 128 characters.
Logdump> RECLEN 128
5. Viewing the records: To view particular records in the trail files, navigate as below in the local trail file.
a) First record in the trail file: Here “0” is the beginning of the trail file
Logdump> POS 0
b) Move to a specific record, at a particular RBA
The “xxxx” is the RBA number.
Logdump> POS xxxx
c) Next record in the opened trail file
Logdump> N
Or
Logdump> NEXT
d) Moving forward or reverse in the trail file
Logdump> POS FORWARD
or
Logdump> POS REVERSE
e) Skip certain number of records
Here ‘x’ is the number of records you want to skip.
Logdump> SKIP x
f) Last record in the trail file
Logdump> POS last
6. Filter Commands:
We can use filter commands to view the specific operations or data records, a record at a specific RBA, the record length, record type, etc. using the commands below.
To start filtration, use the “filter” keyword, followed by include or exclude. These options allow the data to be removed or shown, based on the filter criteria. Then apply other conditions like file name, rectype, iotype etc. Here rectype is record type and iotype is input output type.
There are number of operation we can filter using the Logdump. To view the list of operation types and the number assigned to them, run below command.
a) Show the Record Types
Logdump> SHOW RECTYPE
b) Enable or disable filteration:
Logdump> FILTER [ ENABLE | DISABLE ]
Filter Records by Table Name
Logdump> FILTER INCLUDE FILENAME CC_APP.IMAGE_DETAIL
c) Filter Records by Operation Type: Operation types are Insert, Update, and Delete.
Logdump> FILTER INCLUDE IOTYPE INSERT
d) Filter Records using the operation number
You can specify the IOTYPE by using the equivalent operation number.
Logdump 374> FILTER INCLUDE IOTYPE 160
Logdump 374> N
n
Sample Output:
2013/02/18 00:36:05.000.000 DDLOP Len 1169 RBA 3049
Name:
After Image: Partition 0 G s
2c43 353d 2733 3135 3435 272c 2c42 373d 2733 3135 | ,C5=’31545′,,B7=’315
3735 272c 2c42 323d 2727 2c2c 4233 3d27 5331 272c | 75′,,B2=”,,B3=’S1′,
2c42 343d 2754 4553 545f 3132 272c 2c43 3132 3d27 | ,B4=’TEST’,,C12=’
272c 2c43 3133 3d27 272c 2c42 353d 2754 4142 4c45 | ‘,,C13=”,,B5=’TABLE
272c 2c42 363d 2743 5245 4154 4527 2c2c 4238 3d27 | ‘,,B6=’CREATE’,,B8=’
4747 5553 4552 2e47 4753 5f44 444c 5f48 4953 5427 | GGUSER.GGS_DDL_HIST’
2c2c 4239 3d27 5331 272c 2c43 373d 2731 312e 322e | ,,B9=’S1′,,C7=’11.2.
Filtering suppressed 2 records
Note: Here 160 represent DDL operation and in the detail, we can see the DDL type like below is “CREATE” and suppressed means number of records skipped to reach next filter value.
e) View currently applied filters
Logdump> FILTER SHOW
Sample output:
Data filters are ENABLED
Include Match ANY
Rectypes: DDLOP
Exclude Match ANY
f) Filter on multiple conditions:
We can filter the data of trail file using the multiple conditions together.
For that we can string multiple FILTER commands together, separating each one with a semicolon, as shown in the below example:
Logdump>FILTER INCLUDE FILENAME [SCHEMA].[TABLE]; FILTER RECTYPE 5; FILTER INCLUDE IOTYPE INSERT
The above example will display only “5”,” insert” statement records from the specified table.
Note: [SCHEMA] & [TABLE] is the name of the schema and table, and should be in upper case.
g) Clear the filter in the session
Logdump> FILTER CLEAR
Reference:
This post is from our Oracle GoldenGate 12c Administration Training, in which we cover Architecture, Installation, Configuring & Preparing the Environment, DML Replication – Online Change Synchronization, Initial Load, Zero Downtime Migration & Upgrading using GoldenGate, Oracle GoldenGate Security, Performance of Oracle GoldenGate and Troubleshooting and much more.
Did You Register For FREE GoldenGate Masterclass?
NO! So your next task is to get yourself register for our FREE Masterclass on Learn Oracle GoldenGate 12c for Replication & Migration to start your Goldengate journey. Click on the image below to register for FREE.
Next Task For You
Want to move ahead in your career and want to get a higher Earning Job?
Get 7+ Courses for DBAs & Apps DBA in a bundle program and learn from the Industry’s best Experts.


![AWS DevOps [DOP-C02] Professional Step By Step Activity Guides (Hands-On Labs)](https://k21academy.com/wp-content/uploads/2023/02/DOP-C02-1.png)