![]()
Prometheus is an open-source monitoring system developed by SoundCloud. It is intended to track multidimensional data collection and querying. The main advantages of Prometheus include its tight integration with Kubernetes, a large number of available exporters and libraries, and a fast query language and API. Prometheus, on the other hand, has limitations. And as they begin to scale or reduce the amount of engineering time required to maintain their monitoring toolset, businesses frequently look for Prometheus alternatives.
In this blog, we are going to discuss the top rivals and alternatives of Prometheus.
1. Grafana
Grafana is an open-source platform for metric visualization, monitoring, and analysis. Grafana’s primary focus is time-series analytics. Grafana can display analyzed data using a variety of graph types such as line graphs, heatmaps, and bar graphs. When a monitored metric exceeds a predefined threshold, you receive an alert.
Key features include:
- Alerting: You can receive alerts through a variety of channels, including SMS, email, Slack, and PagerDuty. If you prefer other modes of communication, you can write your own notifiers using a few lines of code.
- Dashboard templating: Dashboard templating allows you to create dashboards that can be reused for multiple purposes. You can, for example, use the same dashboard for production and a test server.
- Provisioning: Scripts allow you to automate everything in Grafana. For example, you can use a script to automatically launch Grafana and a new Kubernetes cluster with the IP address, server, and data sources already specified.
To learn more, Click Here
2. Nagios Core
Nagios, which was founded in the 1990s, is a well-known platform and provider of monitoring tools. While there is some overlap between Prometheus and Nagios, the two technologies approach and capabilities are quite different.
The Nagios Core community is relatively new, and contributions to the open-source project have slowed — whereas Prometheus has a very active and growing community behind it. For this generation of technology companies, Prometheus is a more robust and current solution. Prometheus is clearly the better solution because it has more integrations, better alerting capabilities, and is simpler to use.
However, there are some instances where Nagios may be a viable alternative, particularly for businesses struggling to scale Prometheus to large systems.
Nagios is more concerned with application network traffic and security, whereas Prometheus is concerned with applications and infrastructure. The ability of Nagios to scale out of the box is perhaps its most significant advantage. However, if you use Prometheus alongside a long-term data store, such as Thanos, the benefits will appear minor.
Out of the box, Nagios provides some basic visualizations. However, when compared to using Prometheus alongside a dedicated visualization tool like Grafana or ContainIQ’s custom metrics offering, the offering falls short.
To explore more, Click Here
3. Fluentd
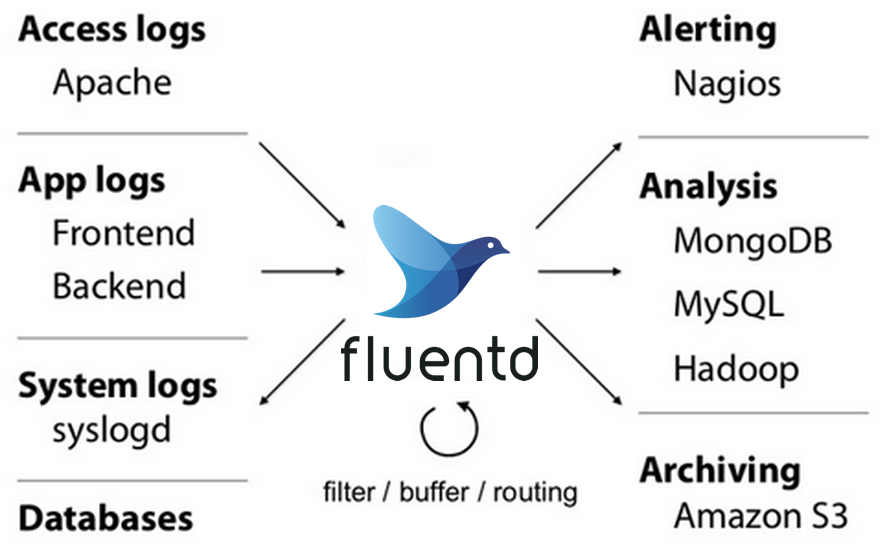
Fluentd is an open source data collector that allows you to unify data collection and consumption for better data use and understanding.
Fluentd provides a unified logging layer between data sources and backend systems. The logging layer allows you to collect various types of logs as they are produced.
Key features include:
- JSON data structure: Allows you to unify all aspects of log data processing such as buffering, filtering, and outputting logs from various sources.
- Pluggable architecture: A pluggable architecture enables you to extend Fluentd’s functionality by connecting multiple data sources and outputs.
- System resources: A Fluentd instance can process 13,000 events per second and runs on 30MB to 40MB of memory. If you require more memory, you can use the Fluent Bit lightweight forwarder.
- Reliability: File-based and memory buffering are supported to prevent data loss on nodes. Fluentd can also be configured to support high availability and robust failover.
4. Sensu
Sensu was first released in 2017 as an open-source set of monitoring tools. After launching a commercial offering, the company was acquired by Sumo Logic in 2021. Sensu now provides both open-source and commercial monitoring tools. Sensu’s open-source offering is frequently compared to Prometheus, and it has several advantages as well as some key differences, including:
- Sensu, like Prometheus, supports time-series metrics, but it also supports status, tracing, and any other JSON-encapsulated data.
- Sensu uses an extensible data model that enables more than just metrics-based monitoring.
- Sensu’s structured data approach, as well as raw metrics, supports high-cardinality observations, including key-value metadata and rich service health status information.
- Sensu is adaptable in that it accepts data from a variety of sources, including Prometheus, StatsD, and Nagios.
- Sensu offers a number of important integrations for larger companies with complex rundecks and remediation processes, such as PagerDuty, ServiceNow, and Jira.
- Sensu provides automated remediation tools and enables engineering teams to gain more context when troubleshooting by enriching Prometheus endpoint data with other metadata.

Sensu can be installed as a sidecar or as a DaemonSet. Users can also use a variety of data stores such as InfluxDB, Elastic, and others.
To get start, Click Here
5. Datadog
Datadog, which was introduced in 2010, is a popular and widely used tool. Datadog, like Prometheus, enables users to collect critical information such as metrics. Datadog is a managed SaaS solution that collects key metrics for almost any system or service.
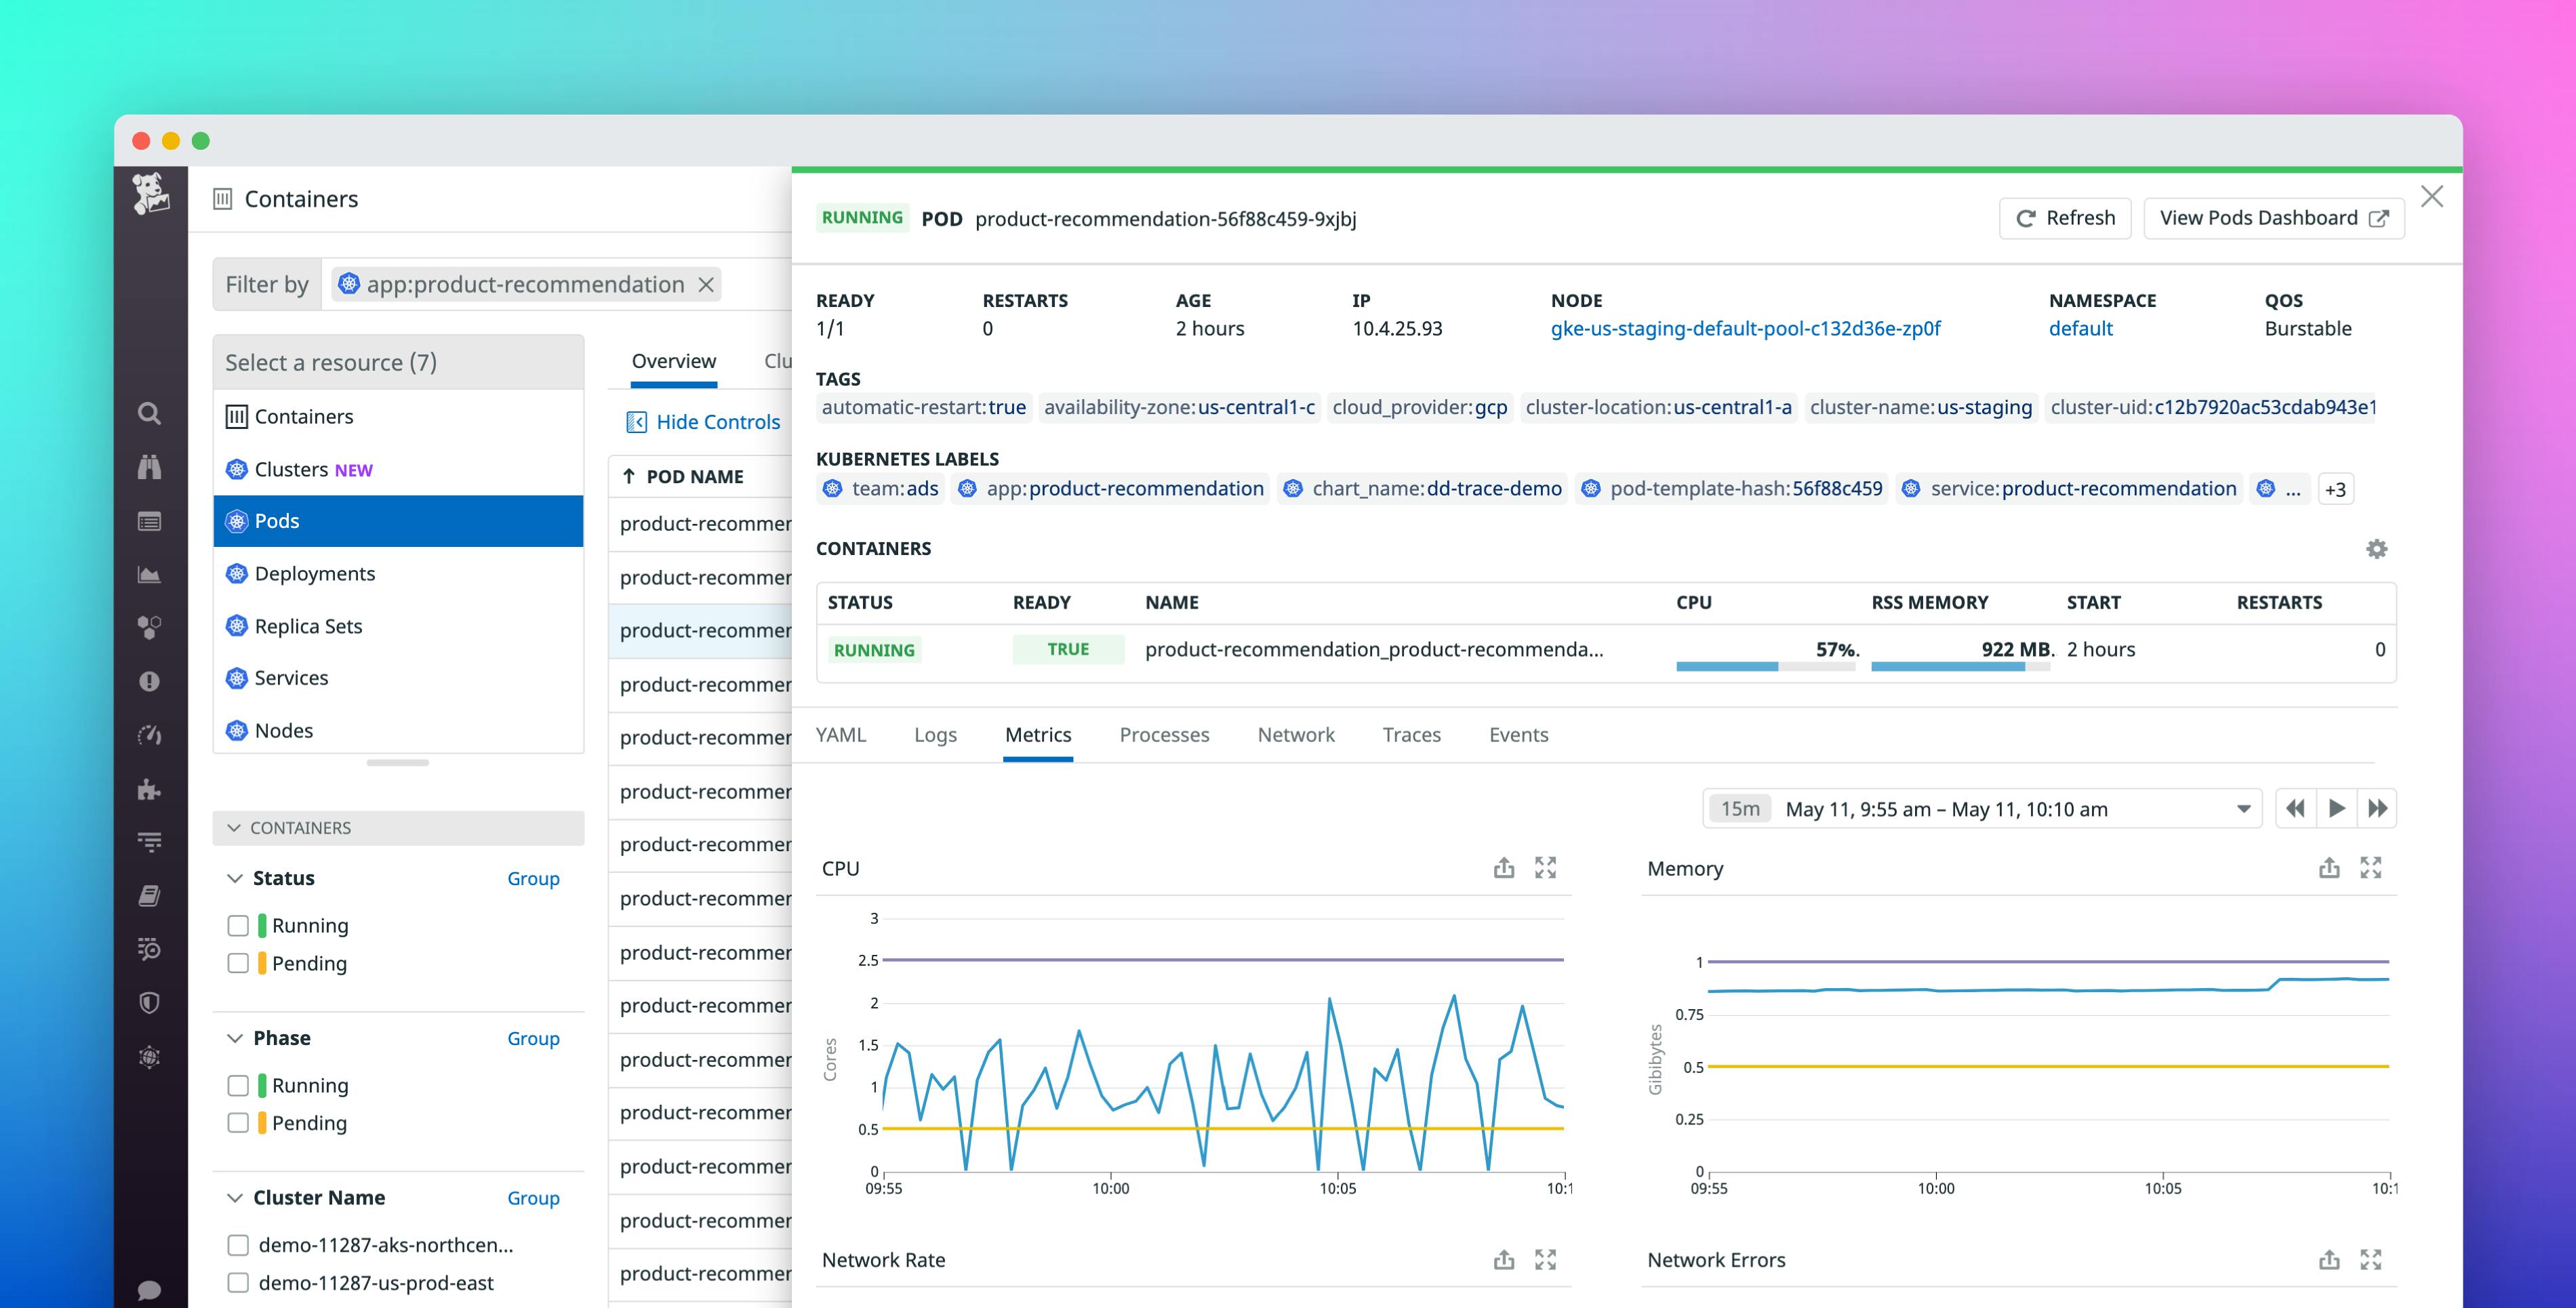
Users can use Datadog to monitor and visualize usage metrics across their entire environment. Datadog enables Kubernetes users to visualize their clusters with pod and node-level views. You can quickly switch between pods and nodes to see usage at specific points in time as well as averages over longer time periods.
Custom metrics are available, and 100 per host per month is included.
Datadog, like Prometheus Alertmanager, enables users to create alerts based on changes or disruptions to specific services. Datadog also includes a number of intelligent alerting features. Datadog’s Enterprise plan customers can receive alerts automatically thanks to machine learning.
Datadog also allows users to automatically detect anomalies and forecast metrics based on past performance. Outlier detection in Datadog is useful when troubleshooting problems on the fly. Users can also correlate metrics to other useful pieces of information by using the correlations feature.
Aside from metrics, Datadog provides other useful tools such as logging, security, and APM.
A free tier of Datadog allows users to collect metrics for up to five hosts and view the data for up to 24 hours. Datadog also provides a variety of paid plans and features. Datadog has Pro and Enterprise plans for metrics:
- Pro: $15 per host per month billed annually, or $18 on-demand, with a 15-month metric retention period.
- Enterprise: $23 per host per month when billed annually, or $27 on-demand, with a standard 15-month metric retention period and customizable retention options.
To explore more, Click Here.
Conclusion
Prometheus is a well-known and mature metrics solution. However, in some cases, Prometheus may not be appropriate for your company.
There are several open-source alternatives, such as Nagios and Sensu. These open-source alternatives are functionally similar but may provide additional benefits for companies with large-scale systems or those in need of additional capabilities.
There are also commercial options available, as well as logging and tracing. We also mentioned Datadog, which is a popular choice for larger businesses.
Finally, keep in mind that Prometheus can be used in conjunction with and integrated with many of these open-source and commercial offerings.
Related/References
- Visit our YouTube channel “K21Academy”
- Prometheus Certified Associate (PCA) Certification Exam | What, Why & How?
- Prometheus Monitoring: Features, Components, Architecture, and Metrics
- An Introduction To Prometheus Dashboard & Its Options
- Kubernetes Monitoring: Prometheus Kubernetes & Grafana Overview
- Certified Kubernetes Administrator (CKA) Certification Exam
- (CKA) Certification: Step By Step Activity Guides/Hands-On Lab Exercise & Learning Path
- Certified Kubernetes Application Developer (CKAD) Certification Exam
- (CKAD) Certification: Step By Step Activity Guides/Hands-On Lab Exercise & Learning Path
Join FREE Masterclass
To know about what is the Prometheus Certified Associate, why you should learn Prometheus, Job opportunities for Prometheus Certified Associate in the market, and what to study Including Hands-On labs you must perform to clean Prometheus Certified Associate (PCA) certification exam by registering for our FREE Masterclass Waitlist.


Datadog and New Relic are excellent alternatives to Prometheus for monitoring, while Fluentd is a viable choice for handling logs.