


![]()
Prometheus is a monitoring solution that stores time series data in the form of metrics. The Prometheus Dashboards visualize the data stored in Prometheus (and other sources).
In this blog, we are going to discuss Prometheus Dashboard & its options.
We will learn about:
- What is Prometheus?
- Prometheus Dashboard Options
- Prometheus Expression Browser
- Grafana
- Prometheus Templates
What is Prometheus?
Prometheus is a popular open-source monitoring and alerting toolkit that was created in 2012. Its primary goal is to provide valid insight into system performance by allowing certain system variables to be monitored. Prometheus graphs the performance of these variables so that users can see the overall performance of their system at a glance. It also allows them to switch between multiple time series variables, allowing users to see how their system performs from various angles.
This data is presented to users in the form of graphs on the Prometheus dashboard, with the option of opening multiple graphs at once for different system metrics, allowing the user to easily compare system performance from various perspectives. Many organizations and companies have adopted Prometheus as a result of its power and adaptability, and the project has a very active developer and user community. It is now a self-contained open-source project, independent of any company. Prometheus became the Cloud Native Computing Foundation’s second hosted project in 2016, following Kubernetes.
Prometheus Dashboard Options
Prometheus has two main components: a powerful backend server for scraping and storing time series data metrics, and a web console or dashboard for visual representations. There are three options for dashboards or visualizations with Prometheus: Prometheus Expression Browser, Grafana, and Prometheus Console Templates. The first two are the most useful, while Prometheus Console Templates can be useful in more advanced situations.
Grafana and the Prometheus Expression Browser are included in the initial installation. Expression Browser is used for quick queries and flexible data exploration, whereas Grafana is used to visualize and track very important metrics over time.
Prometheus Expression Browser
The Prometheus Expression Browser allows you to quickly display time series metrics collected by the Prometheus server. It is a component of the Prometheus suite and can be reached via the endpoint /graph. You can efficiently visualize time series metrics with this tool by displaying them on a graph or in a tabular format, depending on your preferences.
Given the sheer volume of data collected by Prometheus, it can be difficult to know which metrics to monitor, with some people attempting to represent every piece of data they have, clogging up the console. By typing the metric name into the Expression field, you can specify which exact metric you want to display in the Expression Browser.
When you click the Execute button, data for this specific metric, if it exists, is displayed in both a table (on the Console Tab) and a graph (on the Graph Tab), allowing you to switch between the two with a single click. Assume we want to retrieve data on the Prometheus target interval length seconds metric. The time between target scrapes is measured by this metric. In other words, the time between collecting data from a Prometheus target. When you enter this metric into the Expression Browser, you get the following results:

You can get a list of all the time series metrics monitored by Prometheus by visiting the /metrics endpoint. You can have multiple graphs open in the Expression Browser at the same time, but it’s best to keep it to a bare minimum, only monitoring data that is necessary to achieve your goal. Flooding the page with irrelevant graphs/lines on a graph can make it difficult to focus on what is important.

Grafana
Grafana is a metric analytics and visualization suite that is open source. It is most commonly used for visualising time series data for infrastructure and application analytics, but it has a wide range of other applications such as monitoring industrial sensors, home automation, weather, and process control. It includes Prometheus support as a data source, making it simple to integrate Grafana into Prometheus.
To use Grafana as the visualisation dashboard for your Prometheus data metrics, you must first install Grafana. Here is a link to the Grafana installation instructions. Grafana will be listening on http://localhost:3000 with the default login of “admin” / “admin” once it is up and running. It goes without saying that you must change the default login credentials as soon as you log in for the first time.
Features of Grafana
- The Dashboard: It is quite an excelling feature with well equipped and continually evolving part. The dashboard helps us make sense of complex data.
- Alerts: The alerts can be set up and fired whenever there is an anticipated situation.
- Native Support: It has native support of around a dozen databases.
- Built-in Support: It offers built-in support for Prometheus, Influx DB, CloudWatch, Graphite, ElasticSearch.
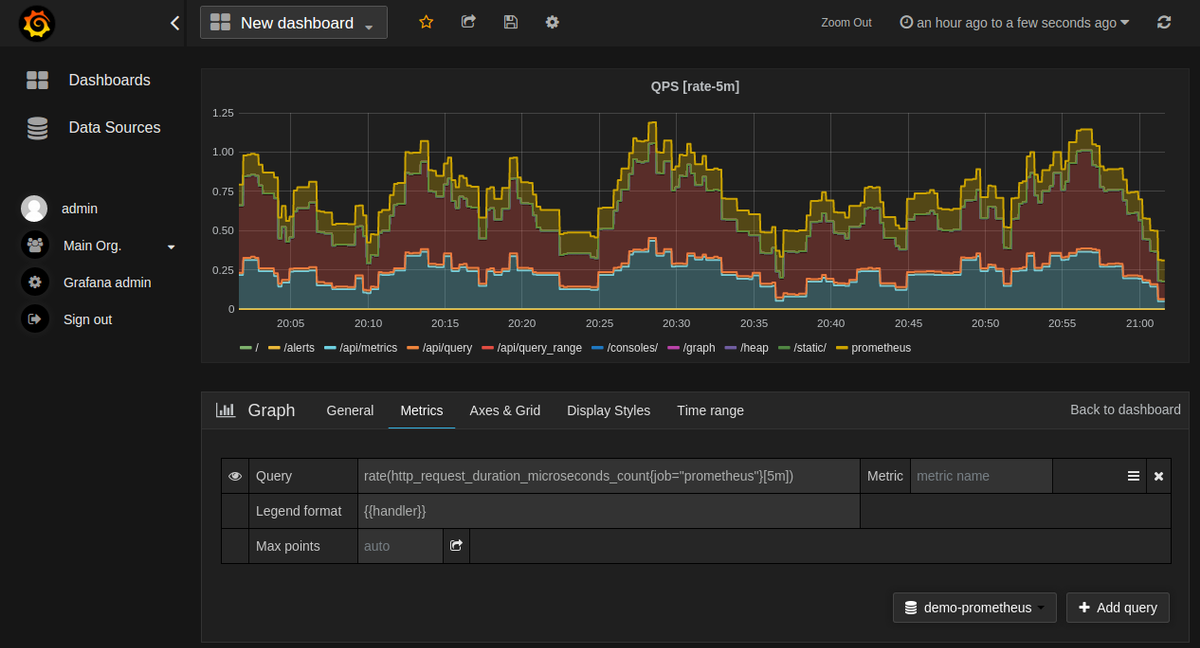
The following is an example of a Prometheus graph configuration:
To learn more about Grafana, click here.
Prometheus Templates
Using the Go templating language, Prometheus console templates enable the creation of arbitrary consoles. Basically, you can build your dashboard console ahead of time by specifying code instructions for how/what your console should look like and what functions it should perform. The Prometheus server then serves these.
Although console templates are extremely powerful, they do require some learning. Users who are new to this type of monitoring are encouraged to start with Grafana. Given its complexity, and in order to keep this post at a reasonable length.
Read more about Prometheus Templates
Related/References
- Visit our YouTube channel “K21Academy”
- Prometheus Certified Associate (PCA) Certification Exam | What, Why & How?
- Prometheus Monitoring: Features, Components, Architecture, and Metrics
- Kubernetes Monitoring: Prometheus Kubernetes & Grafana Overview
- Certified Kubernetes Administrator (CKA) Certification Exam
- (CKA) Certification: Step By Step Activity Guides/Hands-On Lab Exercise & Learning Path
- Certified Kubernetes Application Developer (CKAD) Certification Exam
- (CKAD) Certification: Step By Step Activity Guides/Hands-On Lab Exercise & Learning Path
Join FREE Masterclass
To know about what is the Prometheus Certified Associate, why you should learn Prometheus, Job opportunities for Prometheus Certified Associate in the market, and what to study Including Hands-On labs you must perform to clean Prometheus Certified Associate (PCA) certification exam by registering for our FREE Masterclass Waitlist.


![AWS DevOps [DOP-C02] Professional Step By Step Activity Guides (Hands-On Labs)](https://k21academy.com/wp-content/uploads/2023/02/DOP-C02-1.png)