

![]()
This blog-post will cover everything you need to know about Azure Dashboard, which is sometimes overlooked but is a powerful tool.
Advantages Of Azure Dashboard
- Microsoft Azure gives you the ability to create custom dashboards.
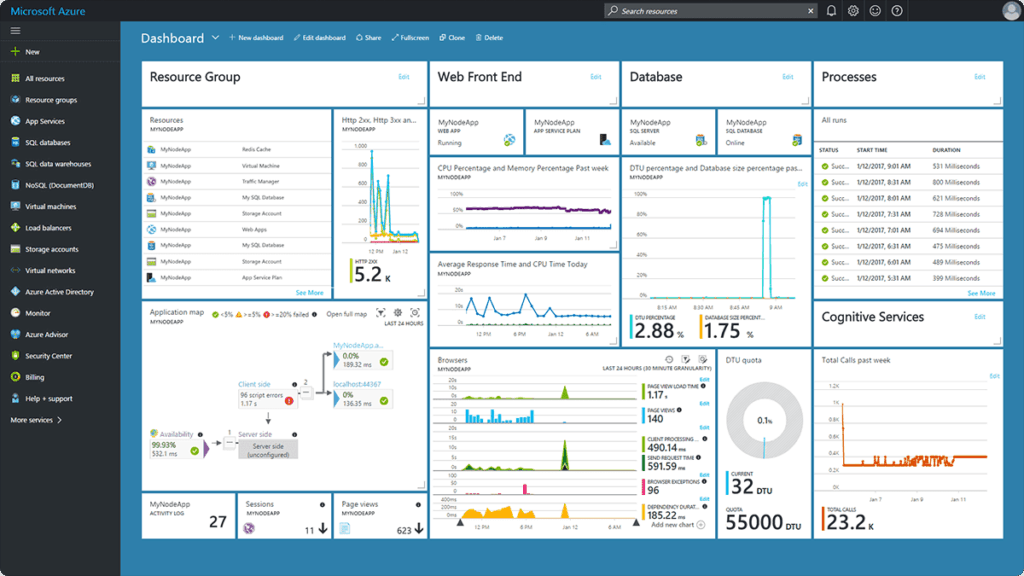
- Imagine you have set up multiple services on the Azure portal and now want to be able to keep track of all of them, here Azure Dashboard comes into the picture.
- It is kind of a collection of shortcuts to resources in Azure, which makes it easy for you to access, organize, and visualize. Azure dashboard lets you have direct access to all your favorite resources in a way that works for you.
- Creating a custom dashboard can enable you to quickly consume relevant information, identify issues, and make navigation easier.
Also read: All you need to know about Azure Resource Group
Supports Multiple Dashboards
Microsoft Azure supports multiple dashboards in the Azure portal that each include tiles showing data from different Azure resources across different resource groups and subscriptions, so you can create different dashboards for different teams or clone an existing one.
Also check: Azure DeVops Certifcation Path to know more about the certifications to be a Microsoft Certified DevOps Engineer.
How To Create A Dashboard
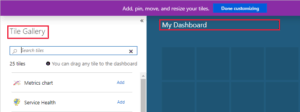
- To create a new private dashboard, sign in to the Azure portal and from the menu select Dashboard, then click on the +New dashboard tab on top.
- Now you will be shown the Tile Gallery, where you can select tiles that you can arrange on an empty grid.
- To change the name of the dashboard click on My Dashboard and enter the name you like.
- After you are done click on Done customizing in the page header.
- The dashboard view will now show your newly created dashboard.
Azure provides multiple ways to create and customize dashboards within the portal:
- Dashboard editor
- Pinning Azure Resources to your dashboard
- Creating a dashboard in JSON
- Auto-generated dashboards
You can make use of the graphical user interface or create a dashboard in JSON where the dashboard is represented programmatically as JSON. It looks similar to the Azure Resource Manager (ARM) Template, and it lets you deploy new dashboards from within this template. To learn more about creating dashboards in the Azure portal click here.
Sharing Azure Dashboard
 To share the dashboard amongst others who are working in your Azure environment, click the Share button at the top of the dashboard tab, and then choose a name, location, subscription. Dashboards by default will have a resource group created, but you can deploy it to different resource groups if you like. Shared dashboards give you the ability to control which user gets access to view the dashboard.
Sample Question
Here is a sample question from Microsoft Azure DevOps Certification Exam [AZ-400]
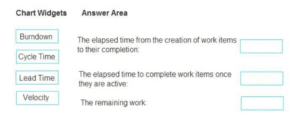
Q. You need to recommend project metrics for dashboards in Azure DevOps. Which chart widgets should you recommend for each metric? Each chart widget may be used once, more than once, or not at all.
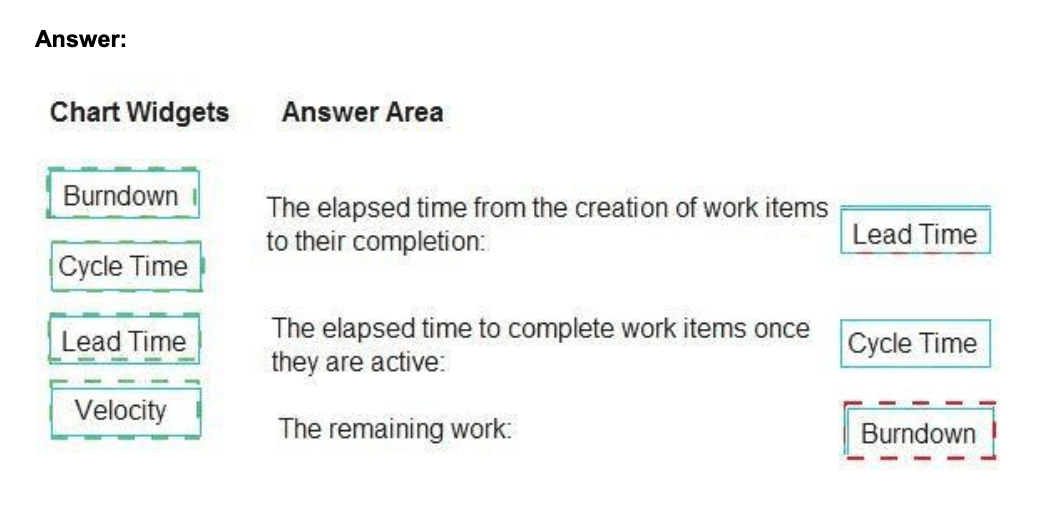
Ans.
 Explanation:
 Explanation:
Box 1: Lead time measures the total time elapsed from the creation of work items to their completion.
Box 2: Cycle time measures the time it takes for your team to complete work items once they begin actively working on them.
Box 3: Burndown charts focus on remaining work within a specific time period.
Related/References
- [AZ-400] Azure DevOps Certification Path
- [AZ-400] Roles And Responsibilities As An Azure DevOps Engineer
- [AZ-400] Microsoft Azure DevOps Certification Exam: Everything You Need To Know
- [AZ-400] Microsoft Azure DevOps Training: Step By Step Activity Guides/Hands-On Lab Exercise
- [AZ-400] Azure DevOps Services for Beginners
Next Task For You
Begin your journey toward Mastering Azure Cloud and landing high-paying jobs. Just click on the register now button on the below image to register for a Free Class on Mastering Azure Cloud: How to Build In-Demand Skills and Land High-Paying Jobs. This class will help you understand better, so you can choose the right career path and get a higher paying job.


![AWS DevOps [DOP-C02] Professional Step By Step Activity Guides (Hands-On Labs)](https://k21academy.com/wp-content/uploads/2023/02/DOP-C02-1.png)