







Assessment of the machine learning algorithm is crucial in determining how accurate and reliable it is. The machine learning algorithm can perform very well during training but poorly during predictions on unseen data. Choosing the proper evaluation metrics is therefore critical.
Various machine learning problems need various approaches for evaluating models. For classification models, some of the metrics include accuracy, precision, recall, F1 score, and ROC-AUC, which aid in measuring prediction performance. For regression models, the metrics include mean absolute error (MAE), root mean squared error (RMSE), and R-square (R2), which measure the prediction errors.
In this blog post, we will learn about the various machine learning evaluation metrics and the proper formula for each of the metric. We will learn more about practical examples and the best time to use each metric.
- Confusion matrix
- Accuracy
- Precision
- Recall/Sensitivity/True Positive Rate
- Specificity
- False Positive Rate
- F1 score
- ROC (Receiver Operating Characteristics) curve
- AUC
- RMSE
- R-squared (R²)
- Performance Metrics in Machine Learning
- Model Evaluation Metrics in Machine Learning
- Evaluating Machine Learning Models
- Model Evaluation Examples
- FAQs
- Conclusion
The goal of a Machine Learning Model is to find out patterns that generalize well on unseen information rather than simply memorizing the information that it had been trained on. once your model is prepared, you’d use it to predict the solution on the analysis or take a look at the data set and then compare the anticipated target to the particular answer (ground truth). this can be a typical approach that’s followed to judge model performance. However, this comparison between foreseen and actual values is performed a supported by a variety of various metrics. the selection of actual metrics depends on the ML drawback at hand.
Related Reading: Machine Learning Algorithms & Their Use Cases

1. Confusion Matrix
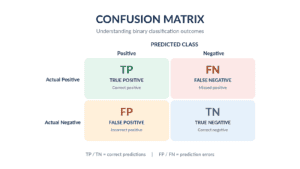
Confusion Matrix is a table, which helps assess the performance of a classifier by comparing the results obtained using the model and the actual values.
It gives insight into how many predictions were accurate and what were the mistakes made.
For binary classification, there are four main elements in the confusion matrix:
- True Positive (TP): When the model correctly classifies the positive class.
- True Negative (TN): When the model correctly classifies the negative class.
- False Positive (FP): When the model incorrectly classifies a negative instance as positive.
- False Negative (FN): When the model incorrectly classifies a positive instance as negative.
Example:
Let us take the example of a machine learning algorithm, which is supposed to determine whether a patient has a disease.
- TP: Patient has the disease and the algorithm correctly classifies him/her as diseased.
- TN: Patient does not have the disease and the algorithm correctly classifies him/her as healthy.
- FP: Patient does not have the disease and the algorithm incorrectly classifies him/her as diseased.
- FN: Patient has the disease and the algorithm incorrectly classifies him/her as healthy.
The confusion matrix is the basis for calculating important classification metrics such as Accuracy, Precision, Recall, Specificity, and F1 Score.
2. Accuracy
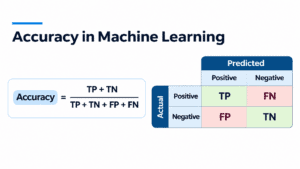
Accuracy is one of the most commonly used metrics for evaluating classification models. It measures the percentage of correct predictions made by a machine learning model out of all predictions.
Accuracy is calculated using the following formula:
Accuracy = (TP + TN) / (TP + TN + FP + FN)
Where:
- TP = True Positive
- TN = True Negative
- FP = False Positive
- FN = False Negative
A higher accuracy generally indicates better performance. However, accuracy can be misleading when working with imbalanced datasets, where one class has significantly more samples than another.
Example:
Consider a machine learning model designed to detect cancer in 100 patients.
- 90 patients do not have cancer.
- 10 patients have cancer.
Suppose the model predicts that all 100 patients are healthy.
In this case:
- True Negatives (TN) = 90
- False Negatives (FN) = 10
- True Positives (TP) = 0
- False Positives (FP) = 0
Accuracy = (0 + 90) / 100 = 90%
Although the model achieves 90% accuracy, it fails to identify any patients who actually have cancer.
This example shows why accuracy alone is not sufficient for evaluating classification models, especially when dealing with imbalanced datasets.
In such cases, metrics like Precision, Recall, and F1 Score provide a more meaningful evaluation of model performance.
3. Precision
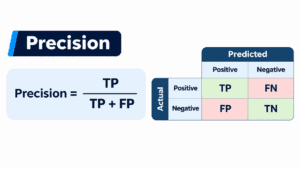
Precision refers to an evaluation criterion that evaluates how many of instances foreseen as positive are actually positive.
This evaluation metric aids in assessing how trustworthy the positive forecasts of the model are.
Precision = TP / (TP + FP)
Where:
– TP = True Positive
– FP = False Positive
Example:
Let’s consider a machine learning model meant to detect fraudulent money transactions.
Let’s assume that the model predicts 100 transactions as fraudulent.
– 80 of the transactions are fraudulent (True Positives).
– The remaining 20 transactions are correct, but they were detected as fraudulent (False Positives).
Precision = 80 /(80 + 20) = 80%
Hence, 80% of the transactions that were marked as fraudulent were actually fraudulent.
When should we consider Precision?
Precision is critical in cases of high costs of false positives.
For example, inappropriately marking legitimate money transactions as fraudulent transactions would mean causing unnecessary declines of payments, dissatisfaction from customers, and further manual evaluations.
The model with high precision provides good forecasting, because it reduces the number of false positives.
However, precision does not provide information about positive cases missed by the model.
4. Recall/Sensitivity/True Positive Rate(TPR)
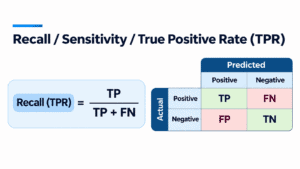
Recall (which is also known as Sensitivity) shows how many times the actual positive cases are correctly detected by an ML model.
Recall is important for determining whether a particular model is effective in finding positive cases.
Example:
Take the example of an ML model that diagnoses whether a person has cancer.
If there are 100 people who have cancer:
– The model detects 90 of them correctly as cancerous (True Positives):
– It misclassifies 10 cases as not having cancer (False Negatives).
Recall = 90 / (90 + 10) = 90%
This implies that the model was able to identify 90% of the people who had cancer and it missed the remaining 10%.
When is Recall Necessary?
Recall is necessary in situations where failing to detect positive cases may cause serious problems.
For instance, in medical diagnosis, missing the fact that a patient has a particular disease may affect the onset of treatment.
A model with high recall will show the greatest number of positive cases.
However, the problem of increasing recall is that a high number of false positives may appear. Hence, to get the best result Precision and Recall should be used together.
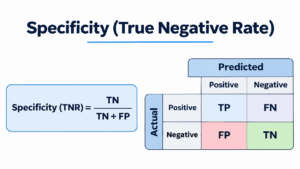
5. Specificity
Specificity, which is sometimes referred to as True Negative Rate (TNR), indicates how successfully a classification model distinguishes negative cases.
This indicates how many negative cases are classified correctly.
Example
Let’s say there are 100 patients who do not have the disease.
– The model recognizes that 95 patients are healthy (True Negatives).
– The model wrongly classifies 5 healthy individuals as having the condition (False positives).
Here, we have the following calculation:
Specificity = 95 / (95 + 5) = 95%
Hence, we conclude that 95% of healthy patients are identified correctly.
When Is Specificity Important?
Specificity is important when minimizing false positives is a priority.
For example, in medical screening, a low-specificity model may incorrectly flag many healthy patients as having a disease, resulting in unnecessary follow-up testing, additional costs, and anxiety.
A model with high specificity correctly identifies a larger proportion of actual negative cases.
Specificity and Recall (Sensitivity) measure different aspects of classification performance:
- Sensitivity measures how effectively the model identifies actual positive cases.
- Specificity measures how effectively the model identifies actual negative cases.
Both metrics are useful when evaluating classification models, particularly in medical diagnosis and other applications where different types of prediction errors have different consequences.
6. False Positive Rate (FPR)
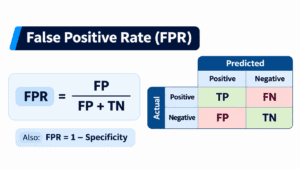
False Positive Rate (FPR) is an evaluation metric that determines the ratio of negative samples mistakenly classified as positive by the machine learning algorithm.
FPR accounts for the likelihood of getting a false alarm from the model.
FPR = FP / (FP + TN)
Where:
– FP = False Positive
– TN = True Negative
False Positive Rate is also interlinked to Specificity:FPR = 1 – Specificity
Example:
Let’s take a machine learning method used for detecting fraudulent transactions.
Let’s assume that we have 1,000 valid transactions.
– This model identified 950 transactions rightly as valid (True Negatives).
– This model made an error of marking 50 valid transactions as frauds (False Positives).
So, FPR = 50 / (50 + 950), which is equal to 5%.
This implies that 5% of valid transactions have been falsely classified as frauds.
When Is Specificity Important?
Specificity is important when minimizing false positives is a priority.
For example, in medical screening, a low-specificity model may incorrectly flag many healthy patients as having a disease, resulting in unnecessary follow-up testing, additional costs, and anxiety.
A model with high specificity correctly identifies a larger proportion of actual negative cases.
Specificity and Recall (Sensitivity) measure different aspects of classification performance:
- Sensitivity measures how effectively the model identifies actual positive cases.
- Specificity measures how effectively the model identifies actual negative cases.
Both metrics are useful when evaluating classification models, particularly in medical diagnosis and other applications where different types of prediction errors have different consequences.
7. F1 score
The F1 Score is a metric used to evaluate machine learning systems; it brings together two indicators–Precision and Recall–in one number using their harmonic average. Using F1 Score is helpful in evaluating classification algorithms where false positive and false negatives play a significant role.
F1 Score = 2 × (Precision × Recall) / (Precision + Recall)
F1 Score varies between 0 and 1, and it means:
– 1 is the best score indicating perfect balance between Precision and Recall.
– 0 means that there is no balance between Precision and Recall.
Example:
Assume that we have a machine learning algorithm reporting fraudulent transactions.
Let’s say that the algorithm has the following performance:
– Precision = 80% (0.80)
– Recall = 60% (0.60)
F1 Score = 2 × (0.80 × 0.60) / (0.80 + 0.60)
F1 Score = 0.686 or 68.6%
It shows that the algorithm has F1 Score value close to 68.6%, thus illustrating the trade-off between Precision and Recall.
When Is F1 Score Important?

8. ROC Curve
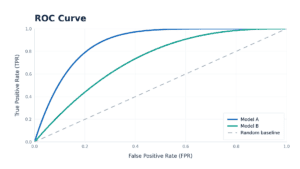
The Receiver Operating Characteristic (ROC) Curve represents a graphical technique which allows for the assessment of the efficiency of a binary classification model at various thresholds of classification. It displays the association of the True Positive Rate (TPR) and the False Positive Rate (FPR). True Positive Rate (TPR) and False Positive Rate (FPR) are two key measures that the ROC Curve uses: True Positive Rate (TPR) represents the percentage of the actual positive cases identified by the model; False Positive Rate (FPR) represents the percentage of the actual negative cases misclassified as positive.
The ROC Curve is a plot with the following axes, i.e.: FPR on X-axis and TPR on Y-axis.
The ROC Curve of good-performing models is normally positioned toward the upper left corner of the graph, which indicates a good True Positive Rate and a low False Positive Rate.
The diagonal on the graph describes performance of random guessing. The curve above this diagonal indicates that the model is capable of distinguishing the positive class from the negative class better than random guessing.
Example:
When Is the ROC Curve Important?
9. AUC (Area under Curve)
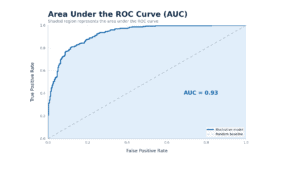
AUC (Area Under the Curve) is a machine-learning metric that quantifies the area under the ROC (Receiver Operating Characteristic) curve.
ROC-AUC assesses how well the classification model can differentiate the positive and negative classes at varying classification thresholds.
Generally, a high ROC-AUC score indicates better ability in differentiating the classes.
How to Understand ROC-AUC Scores
The ROC-AUC score can range between 0 and 1.
– AUC = 1.0, which means the model can differentiate completely between the positive and negative classification
– AUC = 0.9, which indicates very strong ability to classify or differentiate between the two classes
– AUC = 0.5, which suggests the model doesn’t perform better than a random guess
– AUC less than 0.5, which implies the model tends to rank the negative cases higher than the positive cases
The closer the ROC curve is to the upper left, the higher the AUC.
Example:
When Is ROC-AUC Important?

10. RMSE
Root Mean Squared Error (RMSE) is a metric applied in machine learning for the evaluation of how close or far the predicted values are from the actual ones in the context of regression models.
The requirement of the RMSE method lies in finding the square root of the mean of the squared errors of the predictions.
Root Mean Squared Error RMSE can be calculated using the formula as follows:
RMSE = √[(Σ (Actual Value – Predicted Value)²) / n]
Symbols used in the formula:
• Actual Value – indicates the observation made in the dataset.
• Predicted Value – indicates the value resulting from the application of machine learning model.
• n – includes all observations in the dataset.
• Σ – is the symbol for summing up the results.
Example:
Under the case study of using a machine learning model designed to predict house prices, the actual price and predicted prices of three houses are listed in the table below:
| House | Actual Price | Predicted Price |
|---|---|---|
| House 1 | $200,000 | $210,000 |
| House 2 | $300,000 | $290,000 |
| House 3 | $400,000 | $420,000 |
And prediction errors in this case are:
• House 1 – error $10,000,
• House 2 – error $10,000,
• House 3 – error $20,000.
Having applied the RMSE method for this specific case study, the RMSE is calculated: RMSE = √[(10,000² + 10,000² +20,000²)]/3
RMSE is approximately equal to $14,142.
When Is RMSE Important?
11. R-squared (R²)
In the field of regression analysis, R-squared (R²) is an evaluative metric, also known by the term Coefficient of Determination.
This metric serves to quantify the degree of prediction accuracy of a machine learning model based on the variability of its real target values.
R² = 1 – (SSE / SST)
Where:
– SSE – Sum of Squared Errors, calculated as the discrepancy between actual values and predicted values;
– SST – Total Sum of Squares, calculated as the difference between actuals and their (actuals) mean.
Example:
How to Interpret R-squared Values
When Is R-squared Important?
12.Performance Metrics in Machine Learning
The metrics of performance in machine learning are used to determine how good a model can be when making predictions about data it has never encountered before.
The choice of evaluation metric depends on the type of machine learning problem, the type of the dataset, and the importance of prediction errors.
While classification and regression models might use different evaluation metrics.
Classification vs. Regression Metrics
The table below contains a comparison of the commonly used evaluation metrics in machine learning and the situations in which they are used.
| Metric | Model Type | Best Used For |
|---|---|---|
| Accuracy | Classification | Measuring overall prediction correctness |
| Precision | Classification | Minimizing false positives |
| Recall | Classification | Minimizing false negatives |
| F1 Score | Classification | Balancing precision and recall |
| Specificity | Classification | Identifying actual negative cases |
| ROC-AUC | Classification | Comparing class discrimination across thresholds |
| MAE | Regression | Measuring average absolute prediction errors |
| MSE | Regression | Penalizing larger prediction errors |
| RMSE | Regression | Measuring error while emphasizing larger mistakes |
| R-squared (R²) | Regression | Measuring explained variation in target values |
How to Choose the Right Performance Metric
For classification problems, Accuracy is useful when classes are balanced and prediction errors have similar consequences. When working with imbalanced datasets, Precision, Recall, F1 Score, and ROC-AUC can provide more meaningful insights.
For regression problems, MAE and RMSE help measure prediction errors, while R-squared indicates how much variation in the target variable the model explains.
No single metric is suitable for every machine learning problem. The best approach is to select evaluation metrics based on the business objective, dataset characteristics, and consequences of incorrect predictions.
13.Model Evaluation Metrics in Machine Learning
Choosing an evaluation metric becomes necessary for determining the manner in which a machine-learning model performs.
Some different machine learning problems require different evaluation metrics. The best metric depends on the prediction type, the nature of the dataset, and the consequences of making an incorrect prediction.
1. Identify the Type of Machine Learning Problem
In the case of classification problems such as fraud detection or disease diagnosis, use accuracy, precision, recall, F1 score, and ROC AUC.
For regression problems, such as house price prediction or sales forecast, use the mean absolute error (MAE), the root mean squared error (RMSE), and R-squared (R²).
2. Check to See if the Dataset Is Balanced
Accuracy can help inform the performance of a model when the dataset is reasonably balanced and when the outcomes following different prediction errors are largely similar.
However, when one class has many more observations than another, accuracy is often misleading in terms of model performance. Knowing how to use Precision, Recall, and F1 Score as other metrics, as well as Precision-Recall curves, in such situations provides additional information.
3. Understand the Cost of Prediction Errors
Different prediction errors can have different consequences.
For example:
- In fraud detection, missing fraudulent transactions may lead to financial losses.
- In medical diagnosis, failing to detect a disease may delay treatment.
- In email spam detection, incorrectly marking important emails as spam can affect communication.
The evaluation metric should reflect which mistakes matter most for the application.
4. Evaluate Models Using Multiple Metrics
A single metric rarely provides a complete understanding of model performance.
For classification models, consider evaluating Precision, Recall, F1 Score, and ROC-AUC together.
For regression models, compare MAE, RMSE, and R-squared to understand prediction errors and explained variation.
5. Test the Model on Unseen Data
A machine learning model should perform well not only on training data but also on new data.
Use appropriate training, validation, and test datasets to evaluate model performance and reduce the risk of overfitting.
Cross-validation can also help estimate how consistently a model performs across different data splits.
14.Evaluating Machine Learning Models
Evaluating a machine learning model helps determine how accurately it predicts new, unseen data. A proper evaluation process ensures the model performs reliably and reduces the risk of overfitting.
Step 1: Split the Dataset
Divide the data into training, validation, and testing sets. Use training data to build the model, validation data to tune it, and test data to measure its final performance.
Step 2: Train the Model
Train the machine learning model using the training dataset to identify patterns and relationships.
Step 3: Choose Evaluation Metrics
Select suitable metrics based on the problem type:
- Classification: Accuracy, Precision, Recall, F1 Score, and ROC-AUC.
- Regression: MAE, RMSE, and R-squared (R²).
Step 4: Apply Cross-Validation
Use techniques such as K-Fold Cross-Validation to evaluate model consistency across different data splits during development.
Step 5: Test on Unseen Data
Evaluate the final model using the untouched test dataset. Compare its predictions with actual values to measure performance.
Step 6: Analyze and Improve
Identify prediction errors, check for overfitting, and improve the model through feature engineering, hyperparameter tuning, or better training data. Re-evaluate improvements using validation data before final testing.
Related Reading: Machine Learning & Data: Step-by-Step Hands-on Labs
15.Model Evaluation Examples
Understanding machine learning evaluation metrics becomes easier when we see how they are applied to real-world problems.
Example 1: Email Spam Detection (Classification)
Consider a machine learning model designed to classify emails as spam or legitimate.
Suppose the model evaluates 1,000 emails and produces the following results:
- True Positives (TP): 180 spam emails correctly detected.
- True Negatives (TN): 760 legitimate emails correctly classified.
- False Positives (FP): 40 legitimate emails incorrectly flagged as spam.
- False Negatives (FN): 20 spam emails incorrectly classified as legitimate.
The model achieves:
- Accuracy: 94%
- Precision: 81.8%
- Recall: 90%
- F1 Score: 85.7%
These metrics help evaluate how effectively the model identifies spam while minimizing incorrect classifications.
Example 2: House Price Prediction (Regression)
Consider a machine learning model designed to predict house prices.
After comparing predicted prices with actual property values, suppose the model achieves:
- MAE: $12,000
- RMSE: $18,000
- R-squared (R²): 0.88
The MAE indicates an average absolute prediction error of $12,000, while RMSE gives greater weight to larger errors.
An R² of 0.88 indicates that the model explains 88% of the variation in house prices in the evaluated dataset.
These examples demonstrate why classification and regression models require different evaluation metrics.
Related Reading: Google AI/ML: Step-by-Step Hands-on Labs & Projects
16.FAQs
How are Precision and Recall calculated in machine learning?
Precision = TP / (TP + FP), while Recall = TP / (TP + FN). Precision measures how many predicted positives are correct, whereas Recall measures how many actual positives are detected. Precision alone does not measure missed positives, and Recall alone does not measure false alarms.
What is Mean Squared Error (MSE) in machine learning?
Mean Squared Error (MSE) calculates the average squared difference between actual and predicted values. It is commonly used for regression models because it penalizes larger prediction errors more heavily. A lower MSE generally indicates better performance on the same dataset.
What is Mean Absolute Percentage Error (MAPE)?
Mean Absolute Percentage Error (MAPE) measures prediction errors as percentages of actual values. It is useful for regression and forecasting problems, but it becomes undefined when actual values are zero and can be misleading when actual values are close to zero.
What is K-Fold Cross-Validation in machine learning?
K-Fold Cross-Validation divides training data into K subsets called folds. The model is trained on K-1 folds and validated on the remaining fold. This process repeats K times, providing a more reliable estimate of model performance across different data splits.
How is Mean Absolute Error (MAE) calculated?
Mean Absolute Error (MAE) calculates the average absolute difference between actual and predicted values in regression models. Unlike MSE, it does not square errors. A lower MAE indicates smaller average prediction errors on the same dataset.
What is the difference between Cross-Validation and the Holdout Method?
The Holdout Method evaluates a model using a single data split, while Cross-Validation evaluates performance across multiple splits. Cross-Validation provides a more stable estimate during model development, while a separate test set should be reserved for final evaluation.
How can you evaluate a regression model using Python?
You can use Python libraries such as scikit-learn to split a dataset, train a regression model, generate predictions, and calculate evaluation metrics. Common regression metrics include Mean Absolute Error (MAE), Root Mean Squared Error (RMSE), and R-squared (R²).
Which Python libraries are used for machine learning model evaluation?
Common Python libraries include Pandas and NumPy for data processing, Matplotlib and Seaborn for visualization, and scikit-learn for calculating evaluation metrics such as Accuracy, Precision, Recall, F1 Score, and regression errors.
Which evaluation metric is best for imbalanced datasets?
For imbalanced classification datasets, Accuracy alone can be misleading. Precision, Recall, F1 Score, and Precision-Recall curves are often more informative. The best metric depends on whether false positives or false negatives are more costly.
Can R-squared (R²) be negative?
Yes. R-squared can be negative when a regression model performs worse than predicting the mean of the actual target values. An R² of 1 indicates perfect predictions, while an R² of 0 indicates performance equal to the mean prediction baseline.
17.Conclusion
When creating successful and trustworthy AI solutions, evaluating the effectiveness of machine learning models is important. Selecting the suitable evaluation metrics will reveal the errors in predictions, help contrast different models, and enhance the performance of the model in the case of new data.
There are various metrics for classification models, among them Accuracy, Precision, Recall, F1 Score, and ROC – AUC, which make it possible to evaluate the reliability of predictions. Various metrics like MAE, RMSE, and R-squared (R²) allow us to evaluate the predictions and the explained variation for regression models.
By utilizing the proper evaluation metrics alongside cross-validation and testing phase evaluation, you can create machine learning models that will work better.