


![]()
In this blog, we are going to cover a brief introduction to Pandas in Python and a small demo to analyze the titanic dataset using the Pandas library in python.
The most time-consuming part of a data science project is data cleaning and preparation. However, there are many powerful tools to expedite this process. One of them is Pandas which is a widely used data analysis library for Python.
A Quick Glance On Pandas Library
Pandas is a software library written for the Python programming language for data manipulation and analysis. It provides fast, flexible, and expressive data structures designed to make working with “relational” or “labeled” data easy and intuitive. It aims to be the fundamental high-level building block for doing practical, real-world data analysis in Python.
Pandas in Python is built on top of NumPy and is intended to integrate well within a scientific computing environment with many other 3rd party libraries.
![]()
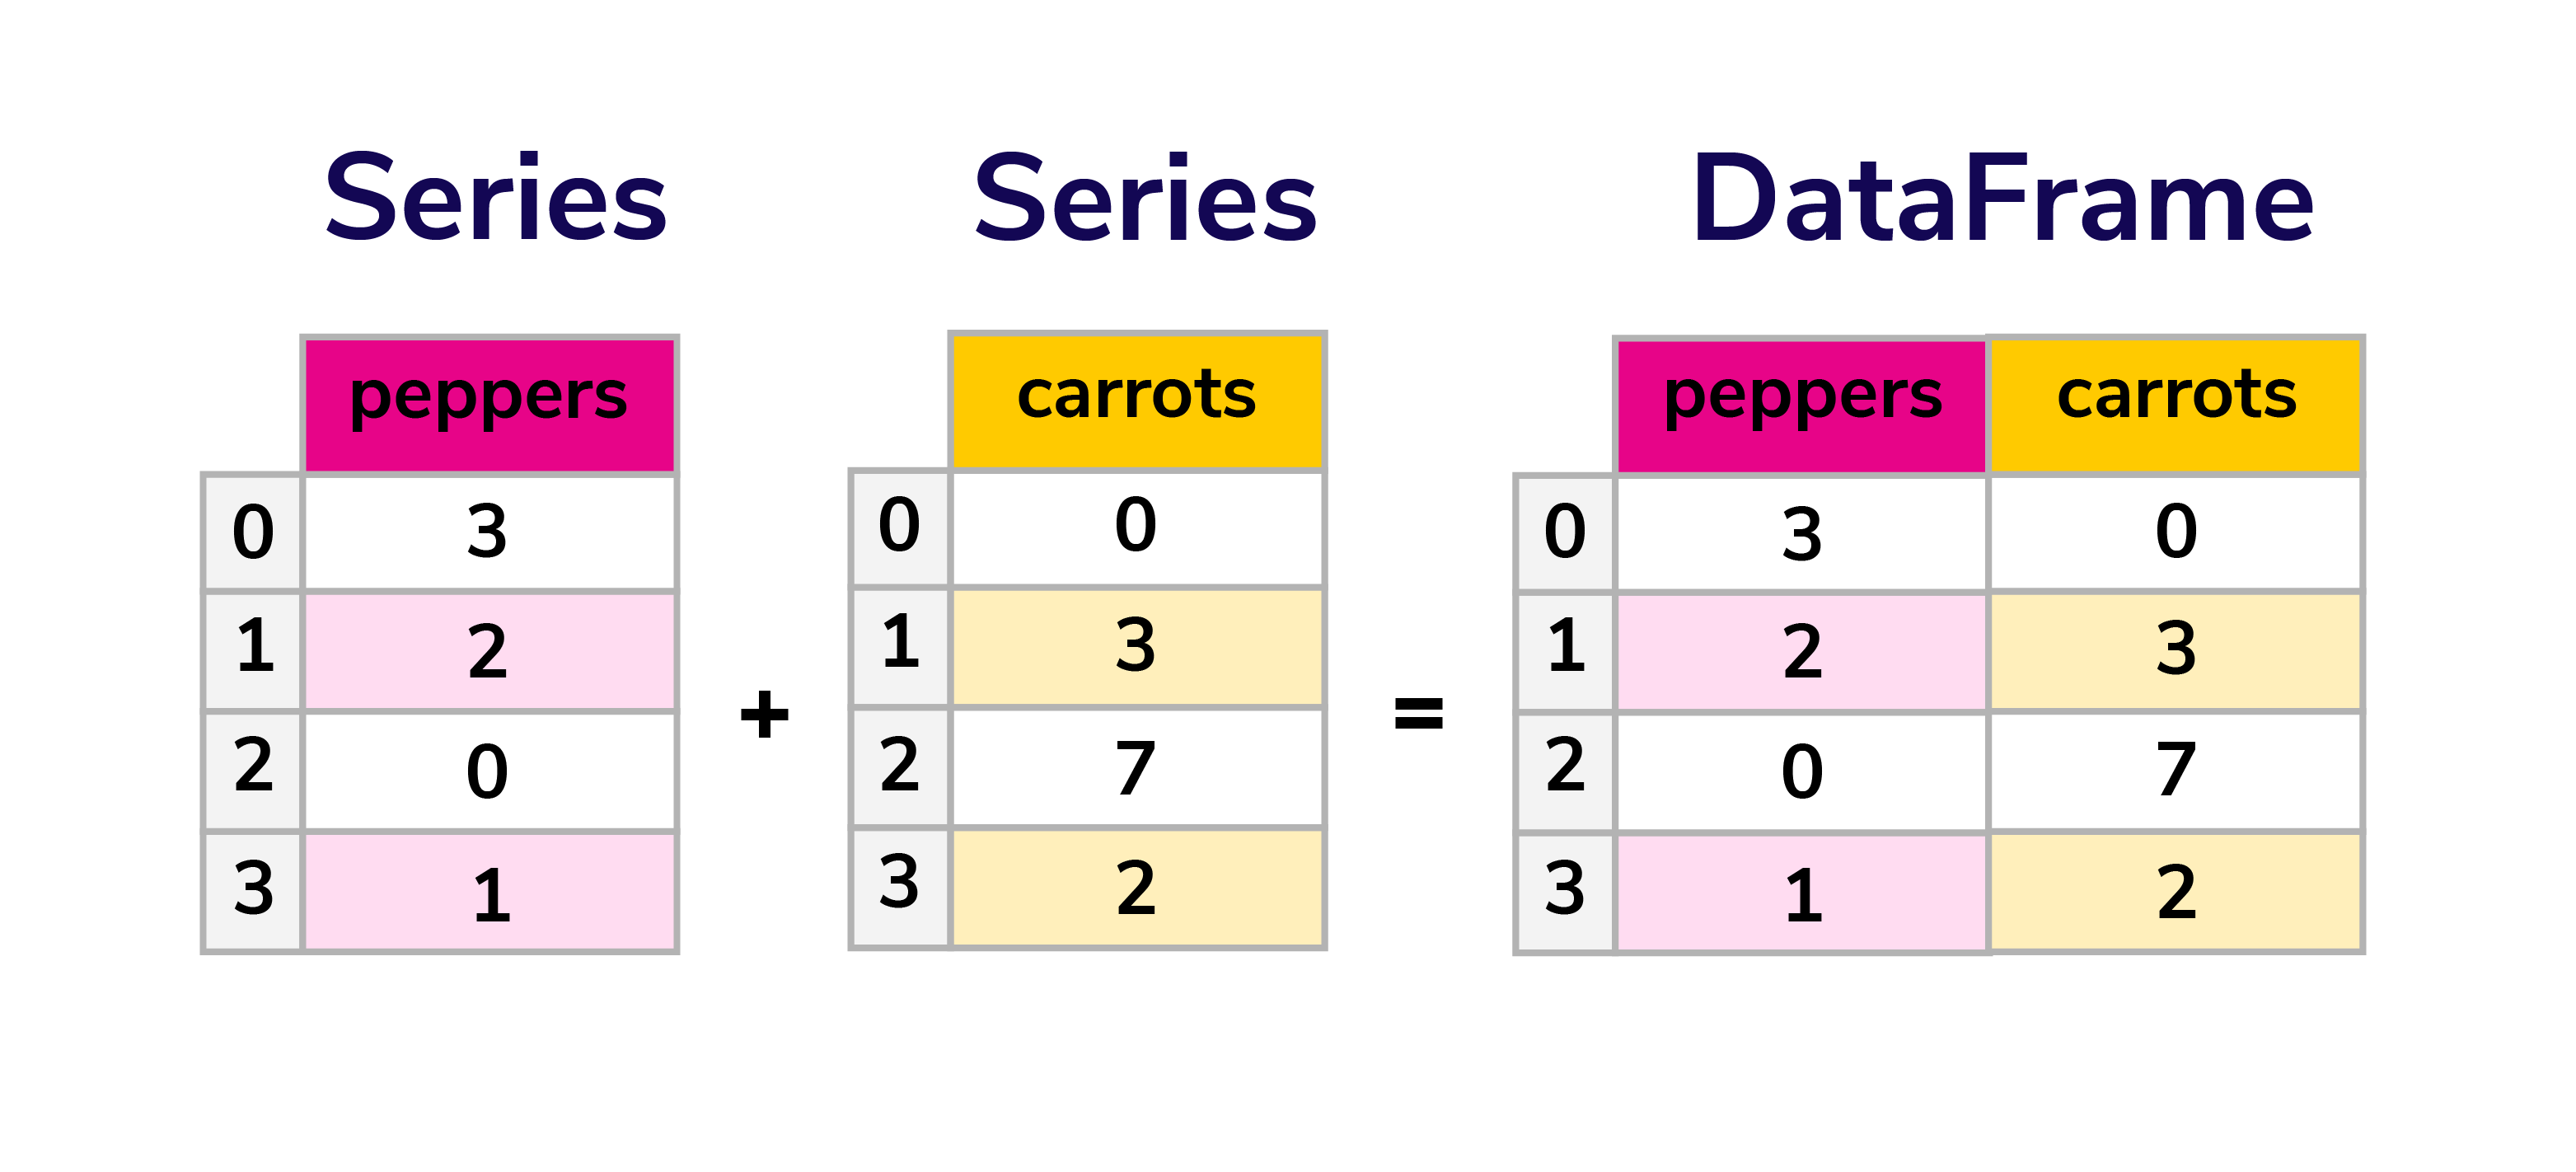
Pandas Data Structure
The two primary data structures of pandas:
- Series (1-dimensional)
- DataFrame (2-dimensional)
handle the vast majority of typical use cases in finance, statistics, social science, and many areas of engineering.
Pandas is suitable for:
- Easy handling of missing data (represented as NaN) in floating point as well as non-floating point data
- Size mutability
- Intelligent label-based slicing, fancy indexing, and subsetting of large data sets
- Flexible reshaping and pivoting of data sets
- Robust IO tools for loading data from flat files (CSV and delimited), Excel files, databases, and saving/loading data from the ultrafast HDF5 format
- Time series data
- Tabular data with heterogeneously-typed columns, as in an SQL table or Excel spreadsheet
- Arbitrary matrix data (homogeneously typed or heterogeneous) with row and column labels
- Any other form of observational/statistical data sets. The data need not be labeled at all to be placed into a pandas data structure
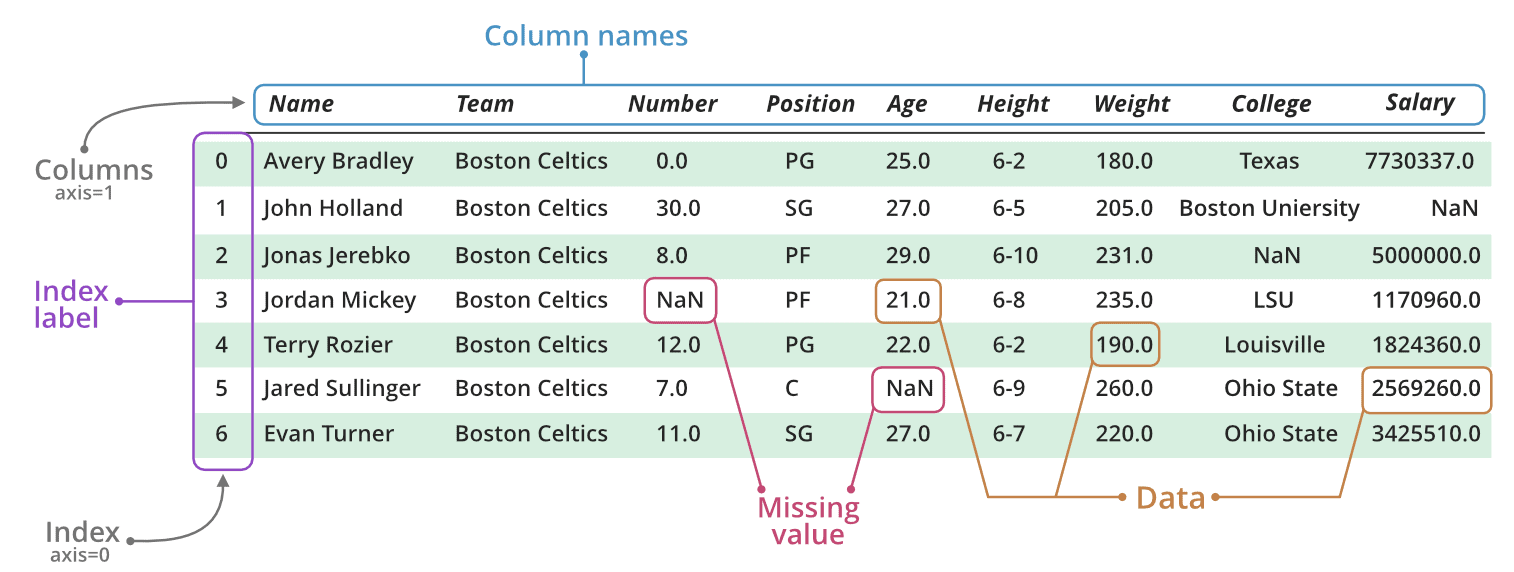
Pandas Dataframe
The Pandas DataFrame is a structure that contains two-dimensional data and its corresponding labels. DataFrames are widely used in data science, machine learning, scientific computing, and many other data-intensive fields.
It is similar to SQL tables or the spreadsheets that you work within Excel or Calc. In many cases, DataFrames are faster, easier to use, and more powerful than tables or spreadsheets because they’re an integral part of the Python and NumPy ecosystems.
Step-By-Step Guide To Data Analysis With Pandas In Python
Let’s look at a demo of how we can use pandas to analyze data, deal with missing values, change data types, filter, sort, select specific column(s), deal with duplicate values, drop and add rows and columns, count values, counting unique values.
Note: The demo is performed in Jupyter Notebook. If you do not have Jupyter Notebook set up in your systems, please check our guide to install Anaconda & get started with the Jupyter Notebook blog.
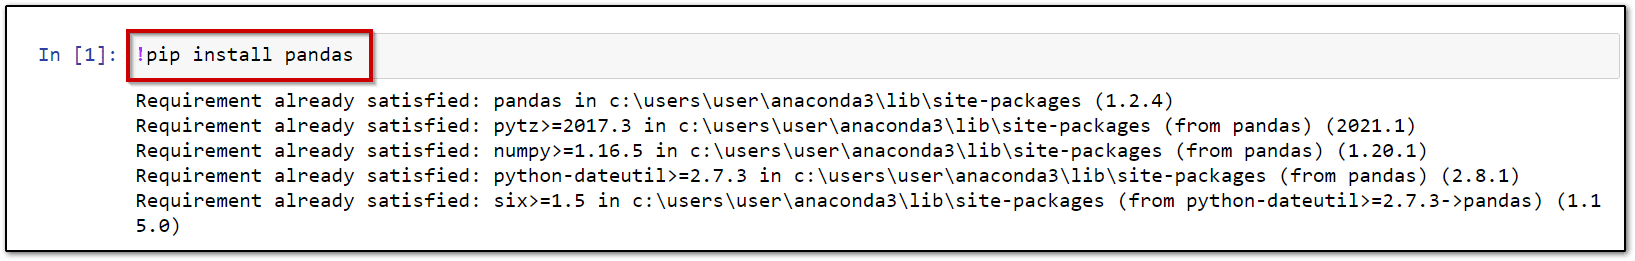
1.) Install the package
Before starting with the demo, you will have to install the package. Run the below command to install the Pandas package.
!pip install pandas
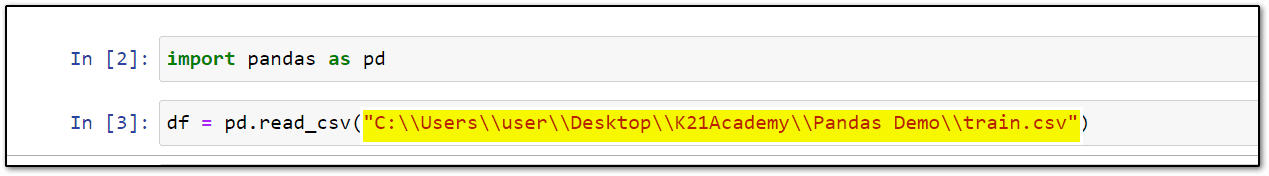
2.) Importing the Pandas package
Step 2: In your Jupyter notebook, run the following command to install the required package.
import pandas as pd
Short Trick: The common shortcut of Pandas is pd so instead of writing “pandas.” you can write “pd.”, but note that there is a dot after “pd” which is used to call a method from Pandas library.
3.) Import the dataset with read_csv
Now that the package is successfully installed, we will import the dataset.
Note: For this demo, we are using the Titanic Dataset (available on Kaggle)
Step 3: To read a dataset, we are going to use read_csv.
here df stands for dataframe (pandas dataframe)
df = pd.read_csv("//YOUR FILE Path")
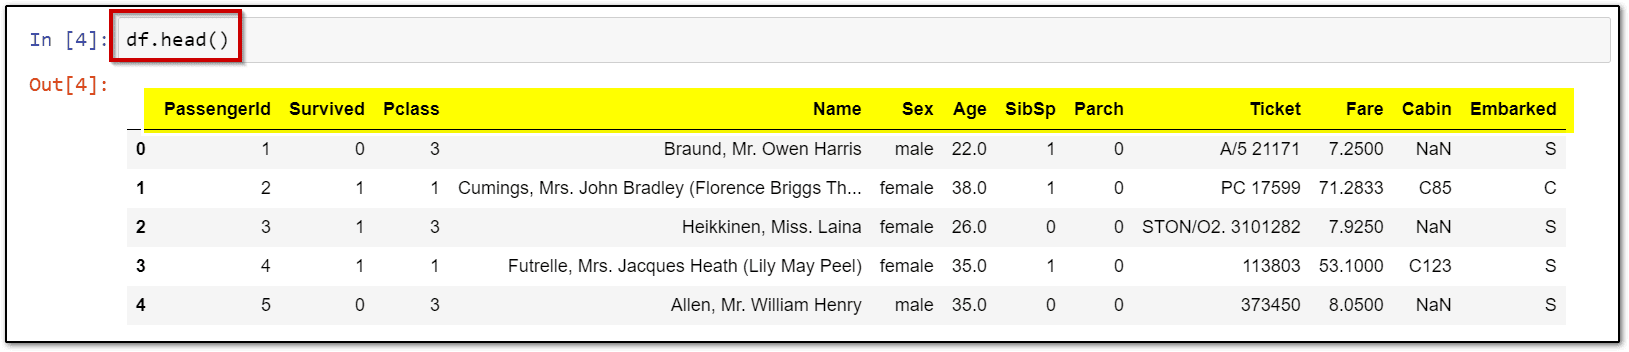
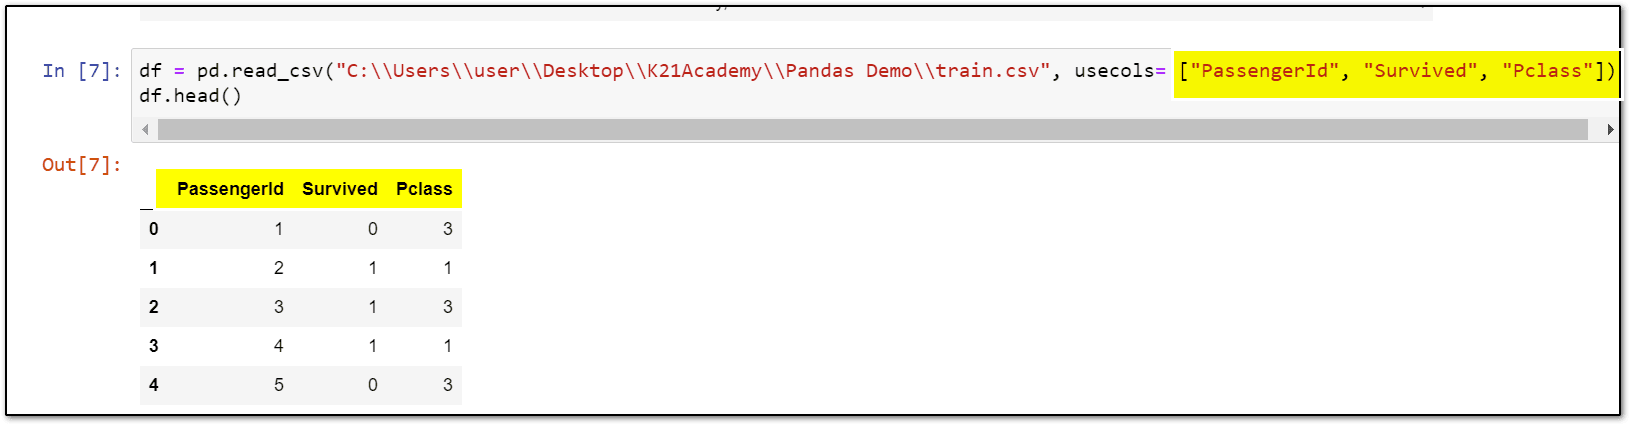
df = pd.read_csv("\\Your File Path\\train.csv", usecols= ["PassengerId", "Survived", "Pclass"])
df.head()
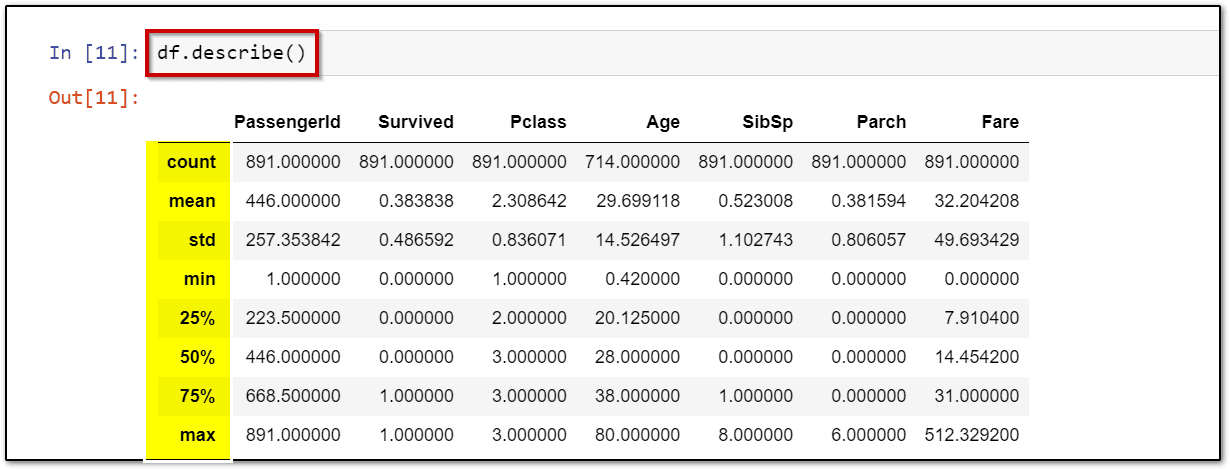
 Step 7: Run the describe() command to get a summary of numeric values in your dataset.
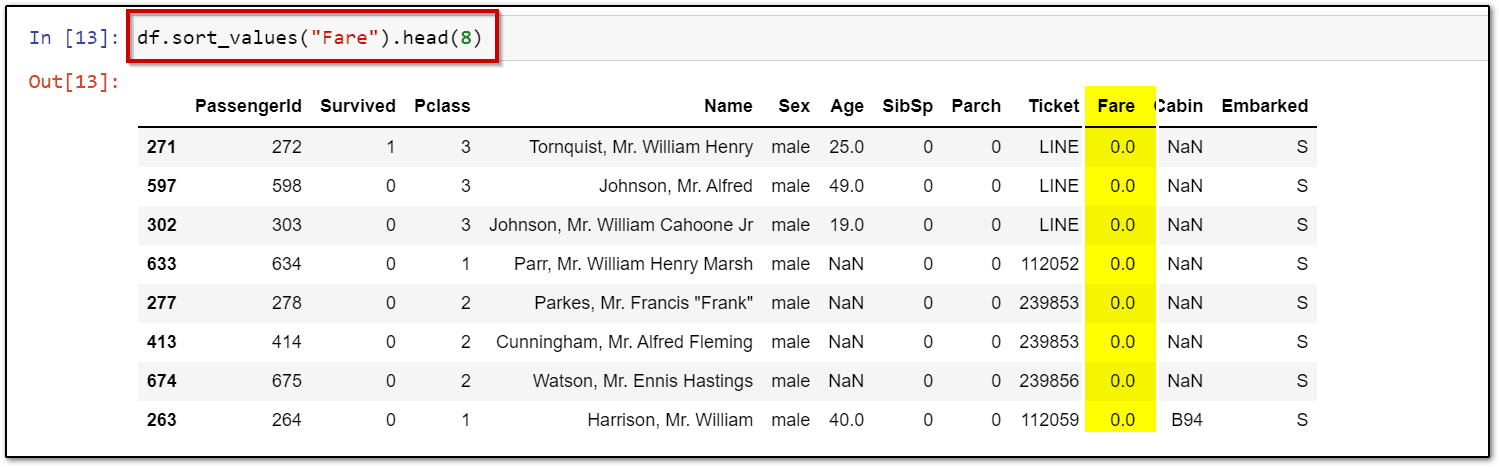
4.) Sort Columns based on specific criteria
df.sort_values("Fare").head(8)
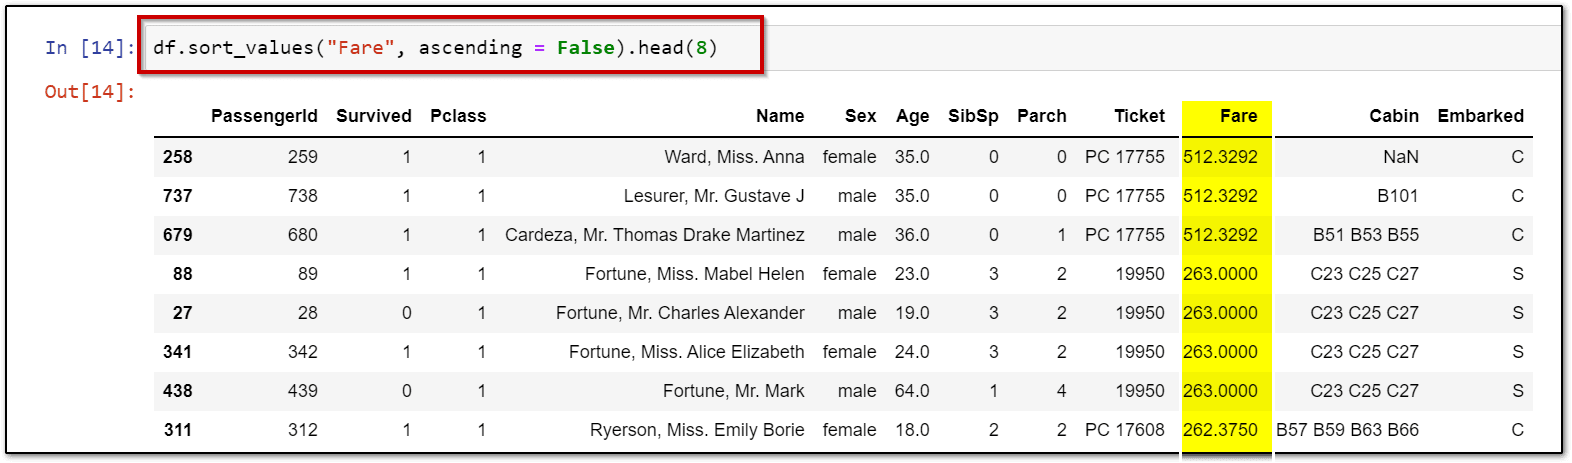
df.sort_values("Fare", ascending = False).head(8)
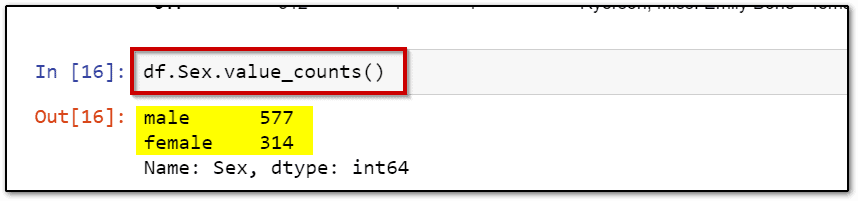
5.) Count the occurrences of variables
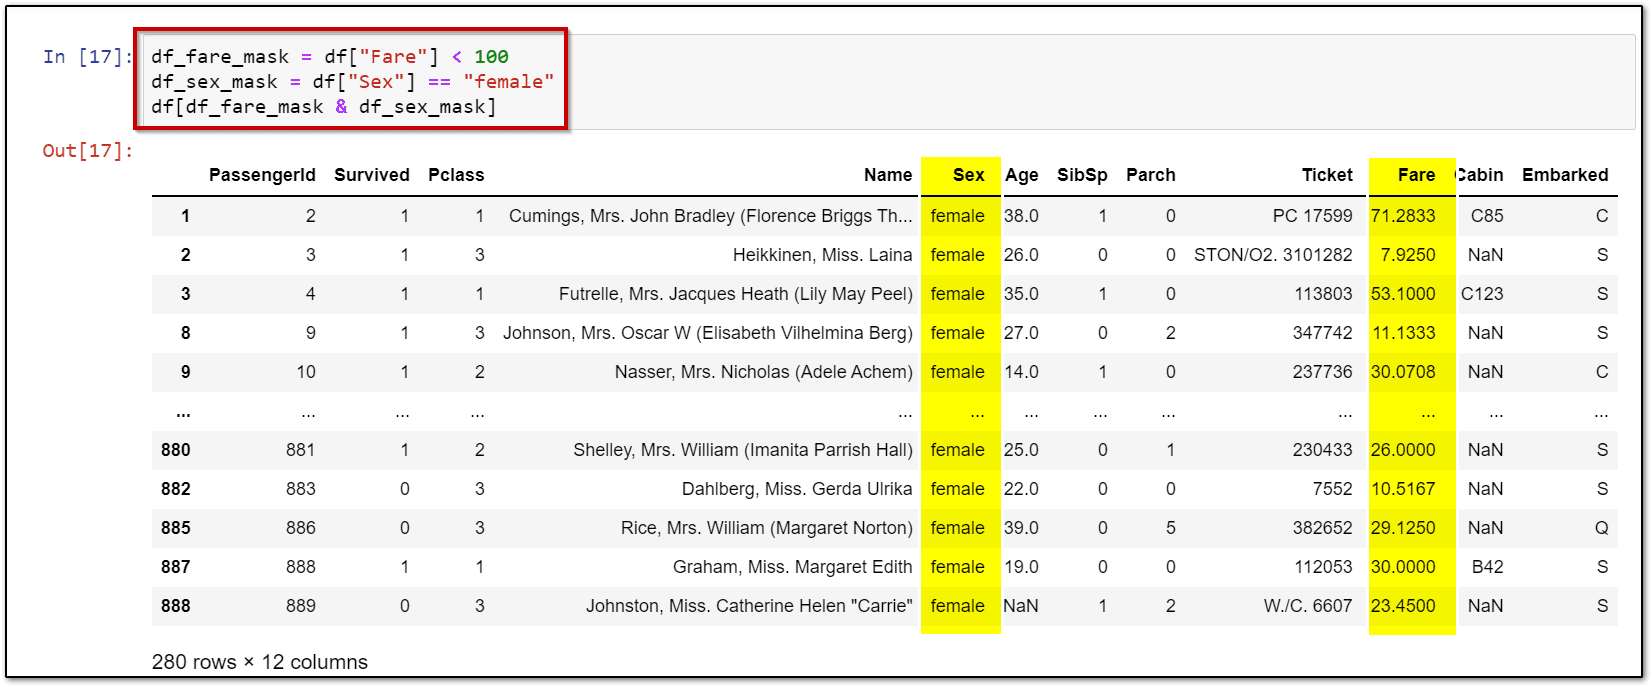
6.) Data Filtering
df_fare_mask = df["Fare"] < 100
df_sex_mask = df["Sex"] == "female"
df[df_fare_mask & df_sex_mask]
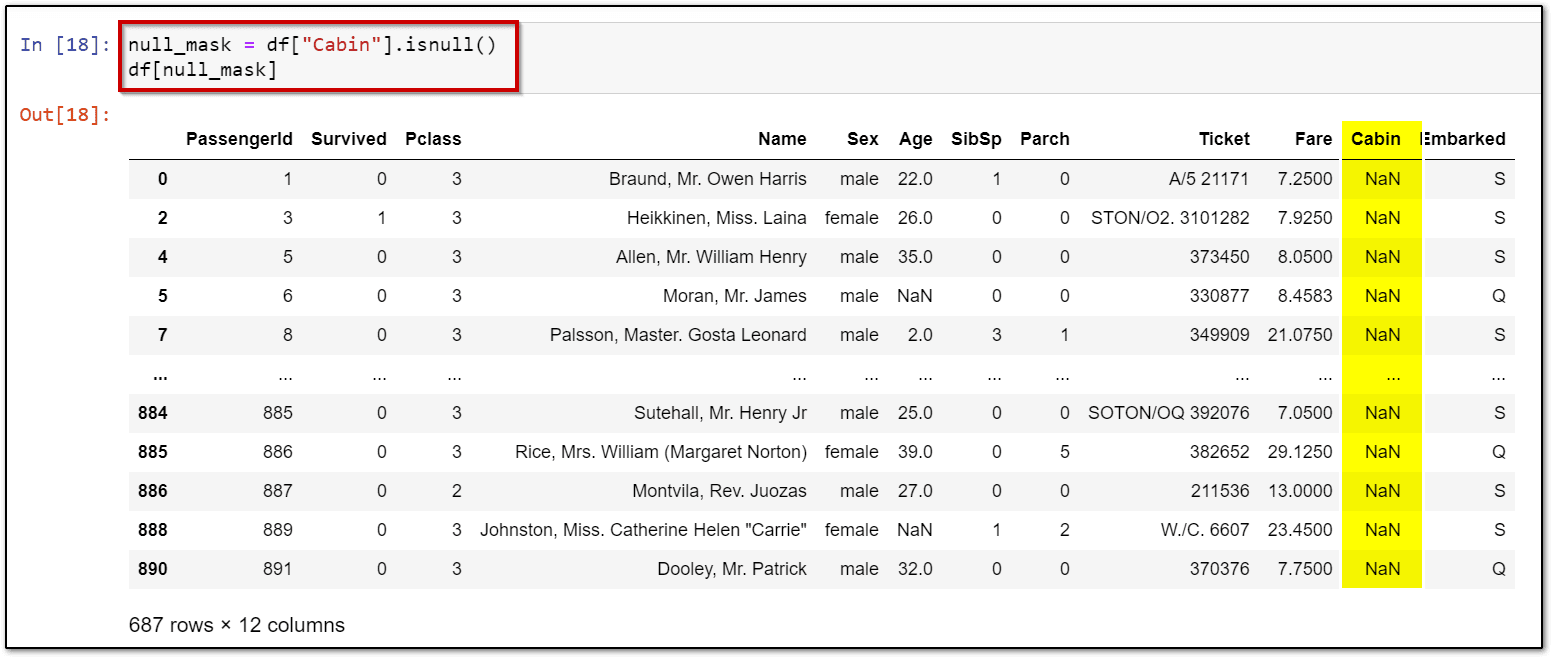
7.) Null values (NaN)
null_mask = df["Cabin"].isnull()
df[null_mask]
Related References
- YouTube K21Academy
- Python For Beginners: Overview, Features & Career Opportunities
- An Introduction To Python For Microsoft Azure Data Scientist | DP-100
- Python For Data Science: Why, How & Libraries Used
- Data Visualization Using Plotly: Python’s Visualization Library
- Introduction to Python, Objects and Data Structure Basics Q&A: Day 1 Live Session Review
Next Task For You…
Data science is a rapidly growing field, and the demand for data science skills and expertise is expected to continue to increase in the coming years. The exponential growth of data has been staggering in recent years.
As data becomes increasingly important in driving business value, the demand for data science professionals is expected to continue to grow in the coming years.
Begin your journey toward becoming a Data Science Expert. Join our FREE CLASS on How to Build a Career in Data Science


![AWS DevOps [DOP-C02] Professional Step By Step Activity Guides (Hands-On Labs)](https://k21academy.com/wp-content/uploads/2023/02/DOP-C02-1.png)