![]()
The Automatic Database Diagnostic Monitor (ADDM) is a tool that analyzes data in the Automatic Workload Repository (AWR) performing accurate and timely diagnosis of the problem. It locates the root cause and provides recommendations for correcting the problem.
For those who are new to performance tuning, AWR (Automatic Workload Repository) is a built-in repository (in the SYSAUX tablespace) that exists in every Oracle Database. At regular intervals, the Oracle Database makes a snapshot of all of its vital statistics and workload information and stores them in the AWR to know more about AWR check our previous blog on Automatic Workload Repository (AWR): Database Statistics.
(Note: If you are just starting out or new to DataBase Performance tuning then I would suggest you check our previous post on Introduction to Performance Tuning In Oracle Database)
The ADDM Analysis Includes the following.
- CPU load
- Memory usage
- I/O usage
- Resource intensive SQL
- Resource intensive PL/SQL and Java
- RAC issues
- Application issues
- Database configuration issues
- Concurrency issues
- Object contention
ADDM also monitors the non-problem areas of the system like wait event classes that are not significantly impacting the system performance, they are identified and removed from the tuning consideration at an initial stage, saving time and effort that would have been spent on items that do not impact overall system performance.
ADDM not only recommends problem diagnostics it also provides possible solutions for the problem. ADDM recommends one or more solutions for the DBA to choose from consisting of a variety of recommended solutions including:
- Hardware changes
- Database configuration
- Schema changes
- Application changes
- Using other advisors
ADDM Analysis
An ADDM analysis will be performed on a pair of AWR snapshots and a collection of instances from equivalent information. The pair of AWR snapshots outline the period of time for analysis, and the set of instances define the target for analysis.
If you’re using Oracle Real Application Clusters (Oracle RAC).
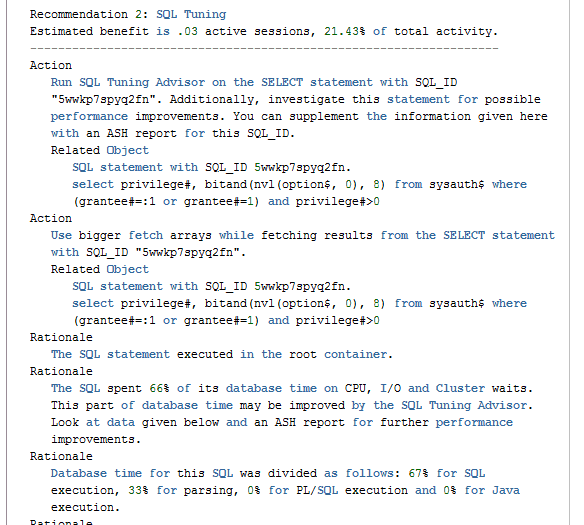
The findings (problems) are listed in order of potential impact on database performance, along with recommendations to resolve the issue and the symptoms which lead to its discovery.
An example from my test instance is shown below.
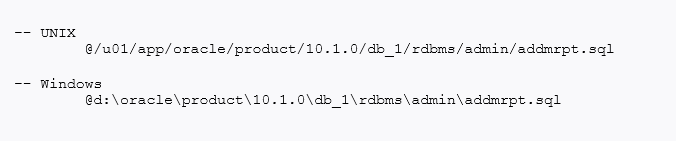
Running ADDM Using addmrpt.sql script
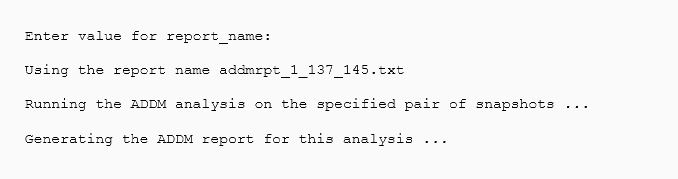
- To invoke ADDM analysis, you can simply run the addmrpt.sql script at the SQL prompt. The script is called as follows:
- It then lists all available snapshots and prompts you to enter the start and end snapshot along with the report name.
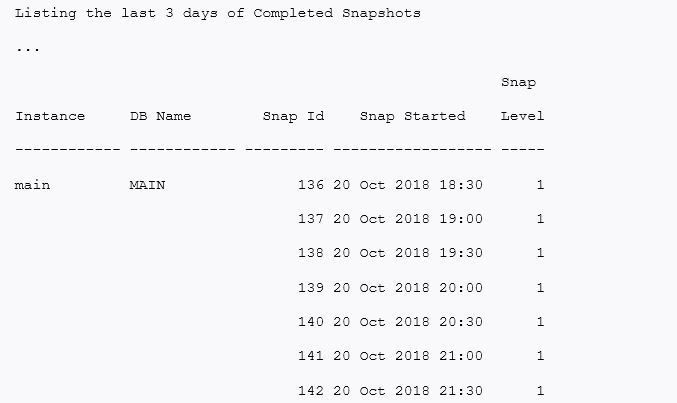
- Provide the snapshot Id
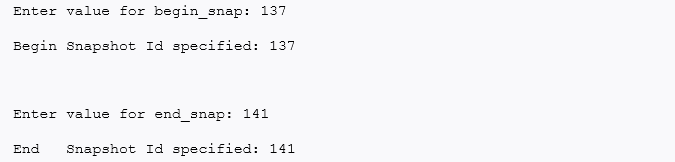
- Enter a report name or accept the default name when prompted.
Diagnosing Performance Problems with ADDM
To diagnose performance problems ADDM analysis results that are automatically created each time an AWR snapshot is taken is reviewed. You can run ADDM manually if need long analysis period or if you want to use different DBIO_EXPECTED setting or change in the analysis mode is required.
ADDM analyzes two AWR snapshots condition being both snapshots are still stored in the AWR and analyze instances that are started before the beginning snapshot and remain running until the ending snapshot.
Whenever possible, you should run ADDM using the Oracle Enterprise Manager. If Oracle Enterprise Manager is unavailable, then you can run ADDM using the DBMS_ADDM package. To run the DBMS_ADDM APIs, the user must be granted the ADVISOR privilege.
ADDM in Database Mode
In RAC configurations, you can run the ADDM in Database mode to analyze all instances of databases. You can still run ADDM in Database mode for single-instance configurations; ADDM behaves as if running in Instance mode.
- task_name [specifies the name of the analysis task that will be created]
- begin_snapshot [specifies the snapshot number of the beginning snapshot in the analysis period]
- end_snapshot [snapshot number of the ending snapshot in the analysis period]
- db_id [database identifier of the database that will be analyzed]
BEGIN DBMS_ADDM.ANALYZE_DB ( task_name IN OUT VARCHAR2, begin_snapshot IN NUMBER, end_snapshot IN NUMBER, db_id IN NUMBER := NULL); END; /
Creating an ADDM task in database analysis mode, and executes it to diagnose the performance of the entire database, for a particular period 120 and 130:
VAR tname VARCHAR2(30); BEGIN :tname := ‘ADDM for 7AM to 9AM’; DBMS_ADDM.ANALYZE_DB(:tname, 120, 130); END; /
ADDM in Instance Mode
Run ADDM in Instance mode to analyze a particular instance of the database. Using the DBMS_ADDM.ANALYZE_INST procedure:
BEGIN DBMS_ADDM.ANALYZE_INST ( task_name IN OUT VARCHAR2, begin_snapshot IN NUMBER, end_snapshot IN NUMBER, instance_number IN NUMBER := NULL, db_id IN NUMBER := NULL); END;
/
Creating an ADDM task in instance analysis mode, and executing it to diagnose the performance of the instance database, for instance number 1 during the time period defined by snapshots 120 and 130:
VAR tname VARCHAR2(30); BEGIN :tname := ‘my ADDM for 7AM to 9AM’; DBMS_ADDM.ANALYZE_INST(:tname, 120, 130, 1); END; /
ADDM in Partial Mode
Run ADDM in Partial mode to use the DBMS_ADDM.ANALYZE_PARTIAL procedure:
BEGIN DBMS_ADDM.ANALYZE_PARTIAL ( task_name IN OUT VARCHAR2, instance_numbers IN VARCHAR2, begin_snapshot IN NUMBER, end_snapshot IN NUMBER, db_id IN NUMBER := NULL); END; /
Creating an ADDM task in partial analysis mode, and executing it to diagnose the performance of instance numbers 1, 2, and 4, during the period defined by snapshots 120 and 130:
VAR tname VARCHAR2(30); BEGIN :tname := ‘my ADDM for 7PM to 9PM’; DBMS_ADDM.ANALYZE_PARTIAL(:tname, ‘1,2,4’, 137, 145); END; /
ADDM Report
Using the DBMS_ADDM.GET_REPORT function, to display a text report of an executed ADDM task:
DBMS_ADDM.GET_REPORT ( task_name IN VARCHAR2 RETURN CLOB);
Text report of the ADDM task specified by tname variable:
SET LONG 1000000 PAGESIZE 0; SELECT DBMS_ADDM.GET_REPORT(:tname) FROM DUAL;
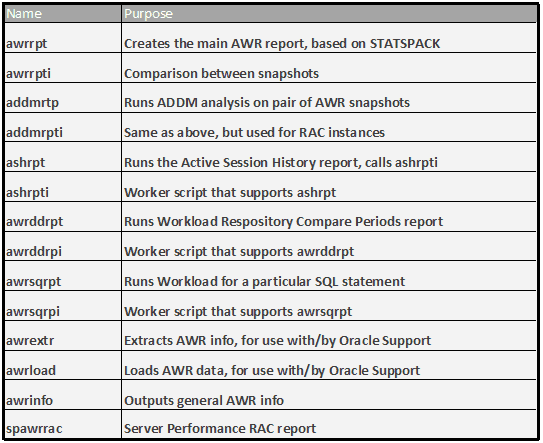
ADDM Scripts
Please stay tuned for our coming post on performance Tuning we will be covering how to do ASH analytics.
These are just a glimpse of some of the factor which needs to be taken care of while considering the performance of your database.
You will get to know all of this and deep-dive into each concept related to Performance Tuning once you will get enrolled in our Performance Tuning On-Premise & Cloud
Another question, which might come to your mind, What are all the things you will get when you enrolled!!
Now it’s your turn to post your doubts in the comment section and let us know where you are facing challenges in Performance Tuning
Related/Further Readings
- Overview of Automatic Database Diagnostic Monitor (ADDM)
- Introduction to Performance Tuning In Oracle Database
- Database Performance Tuning On-Premise & Cloud: Step by Step Hands-On Lab Exercise
- Performance Tuning Process
- For Oracle Database Performance Tuning Guide, click here
Next Task
Want to move ahead in your career and want to get a higher Earning Job?
Get 7+ Courses for DBAs & Apps DBA in a bundle program and learn from the Industry’s best Experts.


Leave a Reply