![]()
This blog post gives a walkthrough of the Step-By-Step hands-on Case-Study on Big Data and Visualization that We cover in our Azure Data Engineer [DP-203] Training program. To understand more about the certification read our blog Data Engineering on Microsoft Azure.
In our Big Data and Visualization case study, we deploy a web app using Machine Learning (ML) to predict travel delays given flight delay data and weather conditions.
The hands-on steps that we include in our Big Data and Visualization case study are:
Let’s understand the Case Study
Big Data And Visualization Case Study
- A Travel Company (Eg. Expedia Group) provides concierge services for business travelers. They always looking for ways to differentiate themselves and provide added value to their corporate customers.
- They want to use predictive analytics to separate themselves in an increasingly crowded market.
- They proposed a solution to provide flight delay risk assessment to customers.
- Most of the premium clients often book their travel within a week of departure, and often ask questions like, “I don’t have to be there until Sunday, so is it better for me to fly out on Wednesday?”
- So, Travel Company believes an innovative solution is to provide customers an assessment of the risk of encountering flight delays, based on historical trends in weather patterns.
- They plan to use 30 years of flight delay and weather data. They plan to use this data to predict the likelihood of flight delays to help customers plan their trips.
- REST API calls to a third-party service will be used to retrieve current weather forecasts.
- Travel company plans to pilot this solution internally, whereby the small population of customer support who service the company’s premium tier of business travelers would begin using the solution and offering it as a supplementary data point for travel optimization.

Also Check: Our blog post on Azure Delta Lake. Click here
Customer Requirements
- Travel Company wants to modernize their analytics platform, without sacrificing their ability to query data using SQL.
- They are looking for a way that allows them to store all of their data in Azure, including the raw source data and the cleansed data from which they query for production purposes.
- They want to understand how they will load their large quantity of historical data into Azure. The data is currently stored on-premises.
- They required the ability to query the present weather forecast and use it as input to their flight delay predictions.
- They desire a proof-of-concept ML model that takes as input their historical data on flight delays and weather conditions in order to determine whether a flight is likely to be delayed or not.
- Need web-based visualizations of the flight delay predictions.
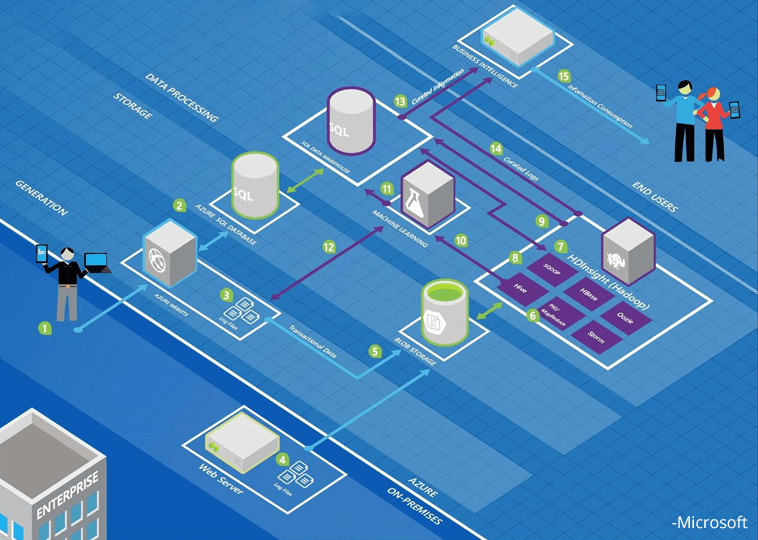
Image ref: Microsoft
Also Check Data Science VS Data Analytics, to know the major differences between them.
Design The Solution For Big Data And Visualization
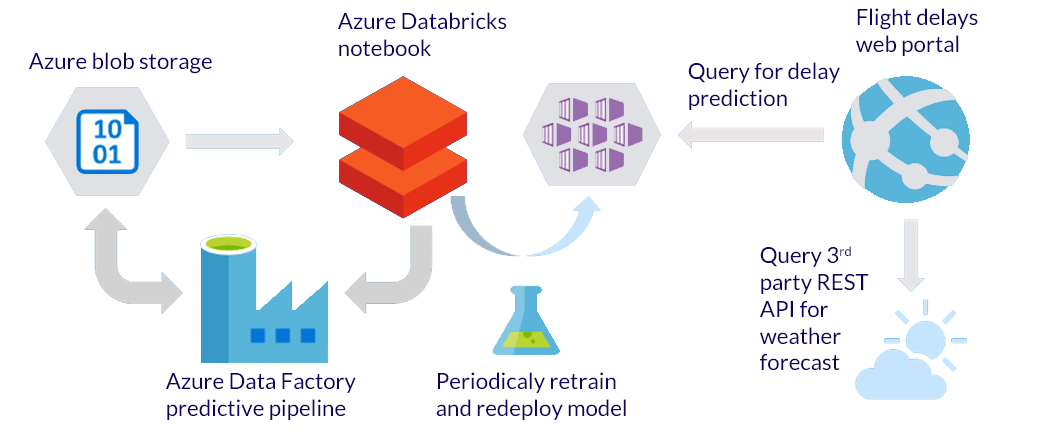
- Historical data being copied into Azure blob storage utilizing Azure Data Factory.
- Historical data explored and prepared using Spark SQL on Azure Databricks.
- Azure ML model created and implemented into a published Predictive Web Service for the web app to query
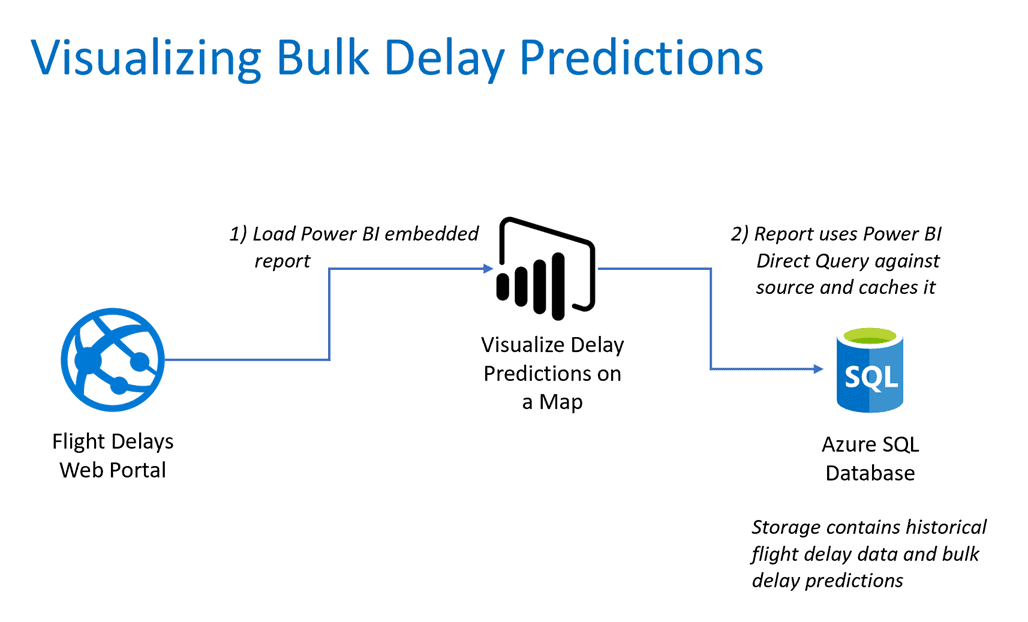
- Batch ML scoring handled via Azure Data Factory. Data are written back to blob storage, for querying via Spark SQL. Data are also written to Azure SQL Database for access from Power BI
- Map visualizations are provided via an embedded Power BI report.
- Weather forecast data is provided through a third-party API, such as OpenWeather.
- Batch-scored predictions are stored in Azure SQL Database, which operates as the serving layer for Power BI reports.
- Azure Key Vault is used as a secret store to centrally manage and securely provide access to secrets, such as connection strings and application keys, to Azure Databricks notebooks and other services, such as Azure Data Factory and the Web App.
- Azure Monitor provides centralized monitoring and logging of all Azure components of the solution.
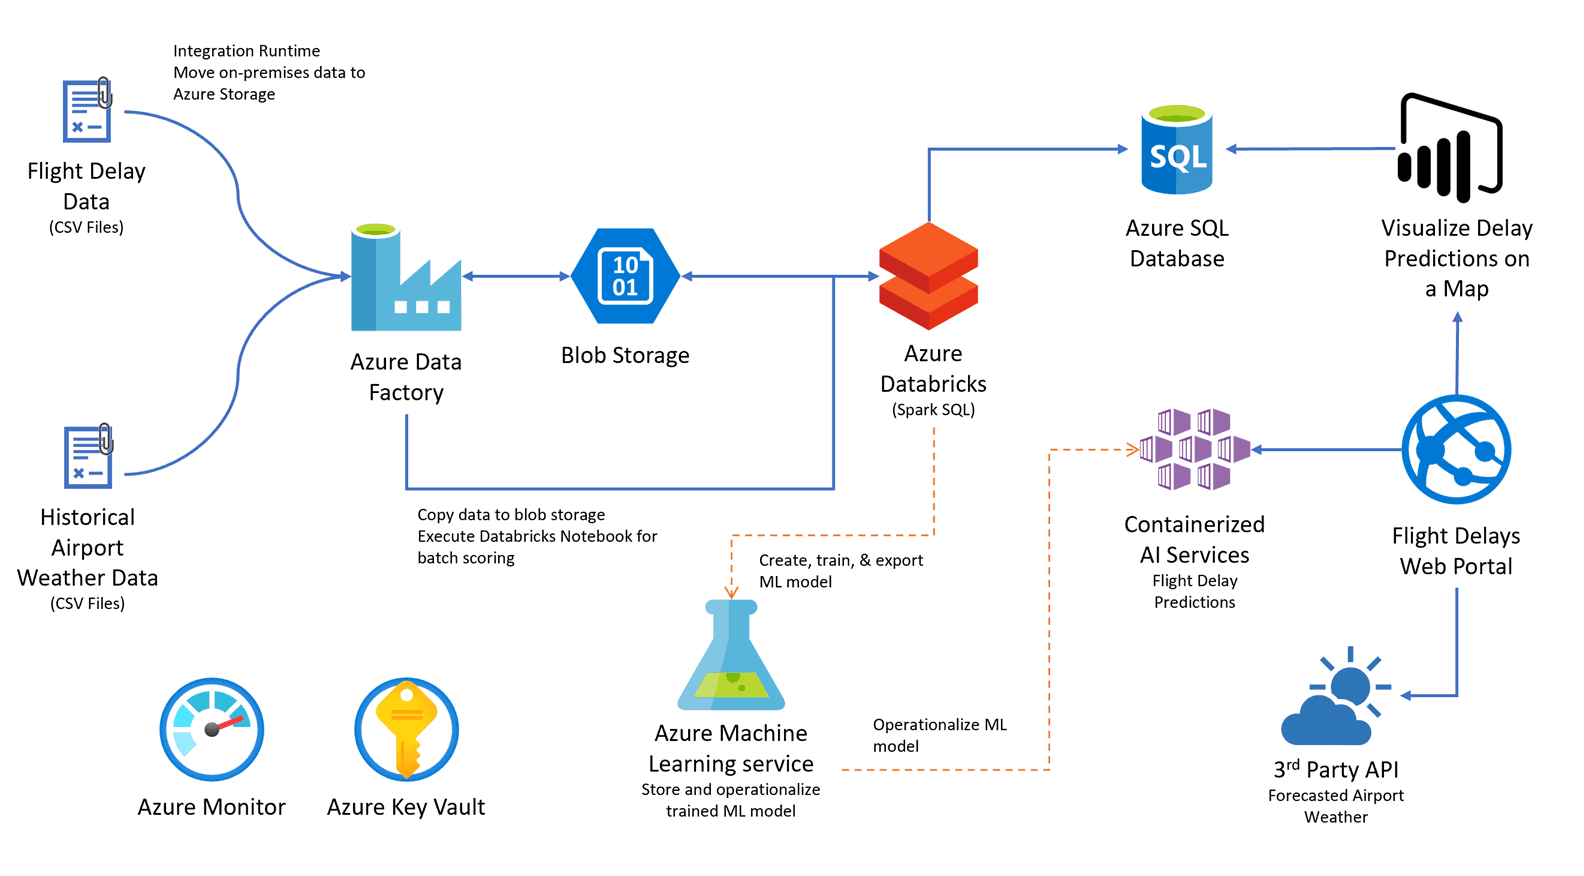
Source- Microsoft
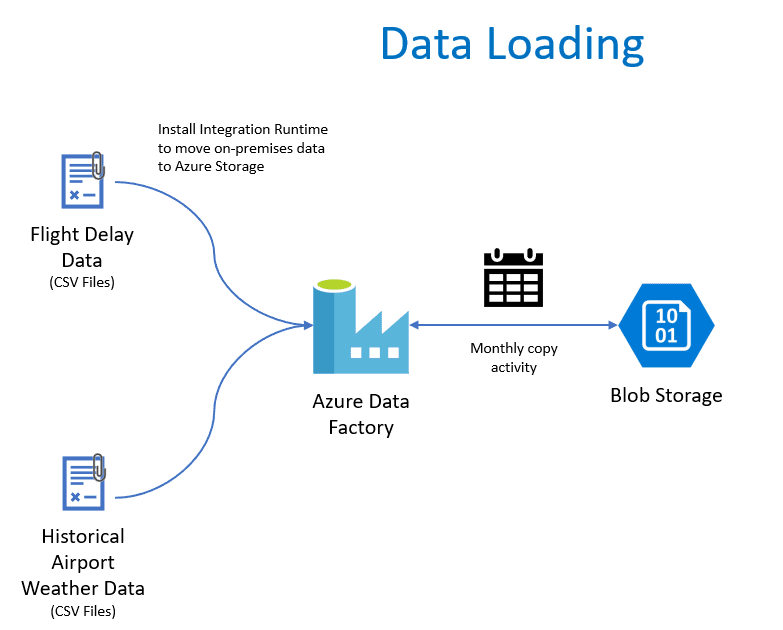
1) Data Loading
Loading historical flight and weather data from their on-premises data store into Azure should be performed using Azure Data Factory (ADF).
Also Check: Our blog post on DP-203. Click here
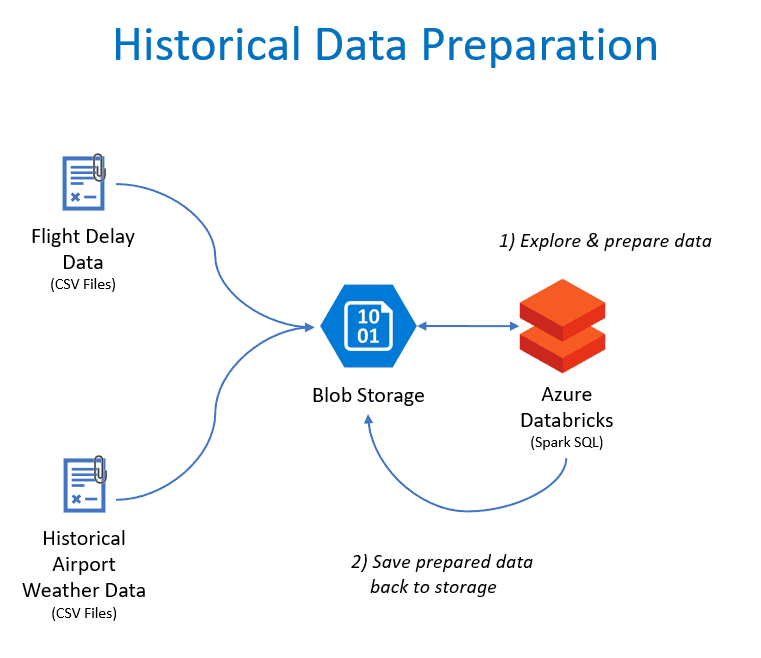
2) Data Preparation
We will use Azure Databricks to prepare their data using SQL using Spark SQL to query files that live on any number of data sources such as Azure Blob Storage.
3) Machine Learning Model
The model will first be built and trained within an Azure Databricks notebook. We can use the programming language of our choice (Python, Scala, R, etc.) as well as Spark SQL to featurize and fit the data into the chosen machine learning algorithm. ML libraries such as Spark MLlib or SciKit-Learn can be used within the notebook to simplify things. Once the model is trained and tested with a sufficient amount of historical data, then the model can be exported for deployment to a web service. The model can also continue to be used within Azure Databricks for batch scoring.
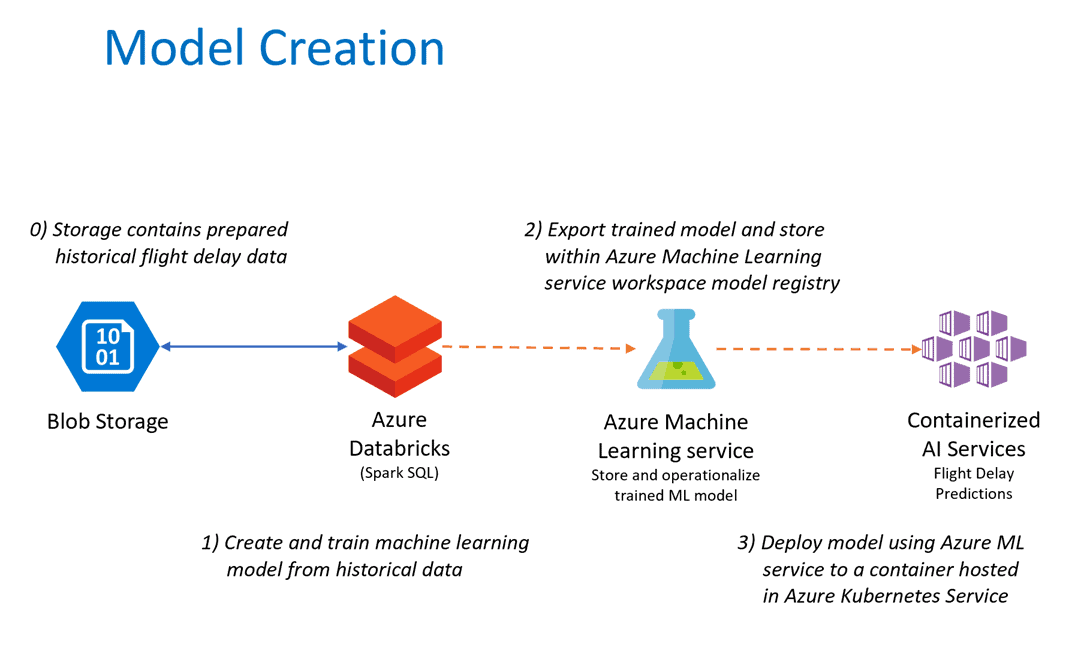
4) Operationalizing Machine Learning
We will use the Azure Machine Learning service and the Azure Machine Learning SDK to register the model in the Azure ML’smodel registry and automatically deploy the model to an Azure Kubernetes Service (AKS) cluster. This creates a web service that can be invoked by any REST client, and the cluster can scale to meet demand as needed. This deployed web service takes the flight information and weather conditions as input and returns feedback with the classification.
5) Visualization And Reporting
Minor changes, such as a change to the data types of a column in the model, can be accomplished using the Query Editor part of the Power BI Desktop application. We will then upload this file to the Power BI service. Access to these reports can be secured to only their internal customer service agents by utilizing the Power BI service. We will then create a Content Pack that contains only the desired dashboards, reports, and datasets and restrict access to those groups in Azure Active Directory to which the customer service agents belong.
We will be covering this Hands-on Case Study: Big Data and Visualization created by Microsoft Cloud Workshop in our Microsoft Azure Data Engineer Certification [DP-200 & DP-201] Training program.
Related/References
- Microsoft Certified Azure Data Engineer Associate | DP 203 | Step By Step Activity Guides (Hands-On Labs)
- Exam DP-203: Data Engineering on Microsoft Azure
- Azure Data Lake For Beginners: All you Need To Know
- Batch Processing Vs Stream Processing: All you Need To Know
- Introduction to Big Data and Big Data Architectures
Next Task For You
In our Azure Data Engineer training program, we will cover 28 Hands-On Labs. If you want to begin your journey towards becoming a Microsoft Certified: Azure Data Engineer Associate by checking out our FREE CLASS.


It’s really great!
Tank you
Hi Najar,
We are Glad you liked our blog.
Please stay tuned for more informative blogs.
Thanks and Regards
Rahul Dangayach
Team K21 Academy