![]()
This blog post gives a walkthrough of the Step-By-Step hands-on Case-Study on Displaying Live Streaming Data using Power BI Service which we will be discussing in detail in our Microsoft Data Analyst Associate [DA-100] FREE CLASS. To understand more about the certification read our blog Microsoft Certified Power BI Data Analyst Associate.
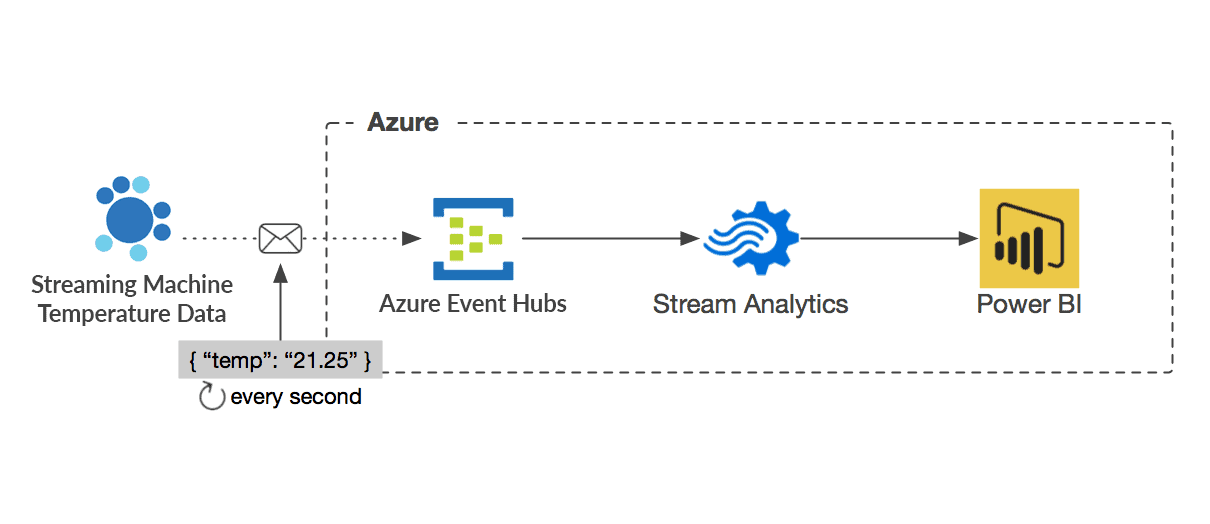
In our Displaying Live Streaming Data using Power BI Service case study, we’ll be reading data from an application that generates live stream data, and then we are going to ingest it by using Event hub, process the data in real-time using Stream Analytics, then we’ll use Power BI to visualize this live streaming data.
The following diagram shows the logical components of the case study, such as Data generator, Azure Event Hubs, Stream Analytics, and Power BI.
Before performing the copy activity, we should understand the basics concept such as Azure Event Hubs, Stream Analytics, and Power BI.
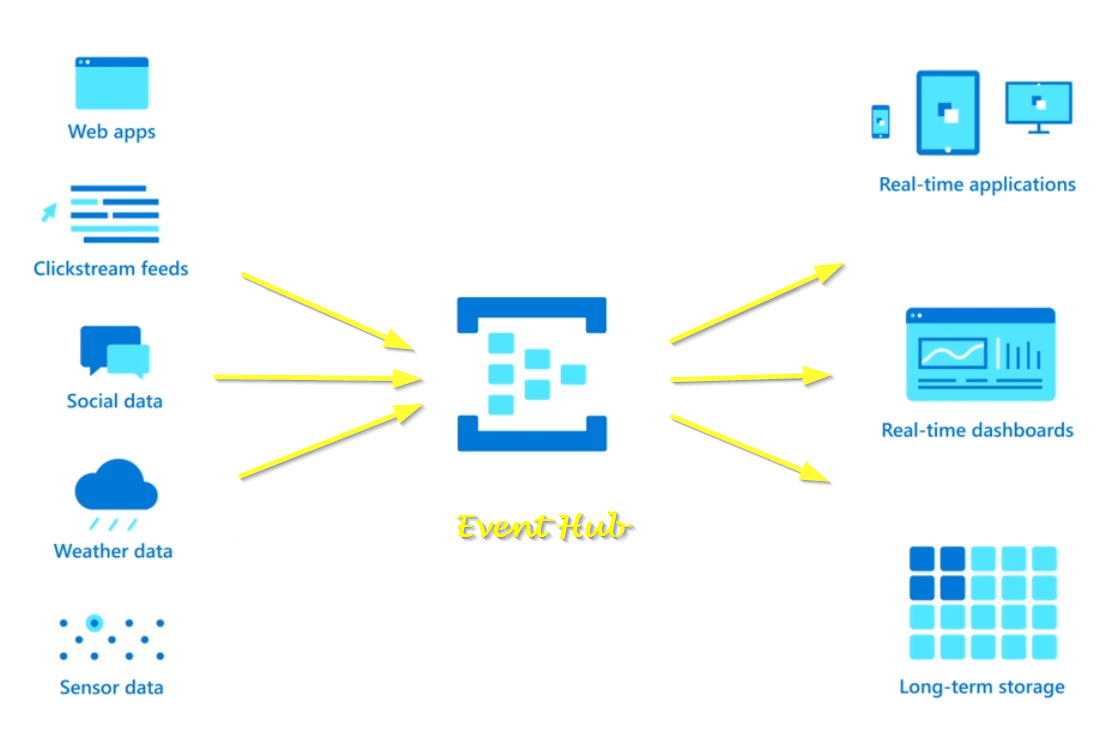
Overview Of Azure Event Hubs
- It is a big data streaming platform and event ingestion service.
- It can process and receive millions of events per second.
- Data sent to an event hub can be stored and transformed by using any real-time analytics provider or storage/batching adapters.
- The scenarios where you can use Event Hubs:
- Live dashboarding
- Analytics pipelines, such as clickstreams
- Anomaly detection (fraud/outliers)
- Application logging
- User telemetry processing
- Device telemetry streaming
Note: If you want to learn more about it, check our Azure Event Hubs blog.
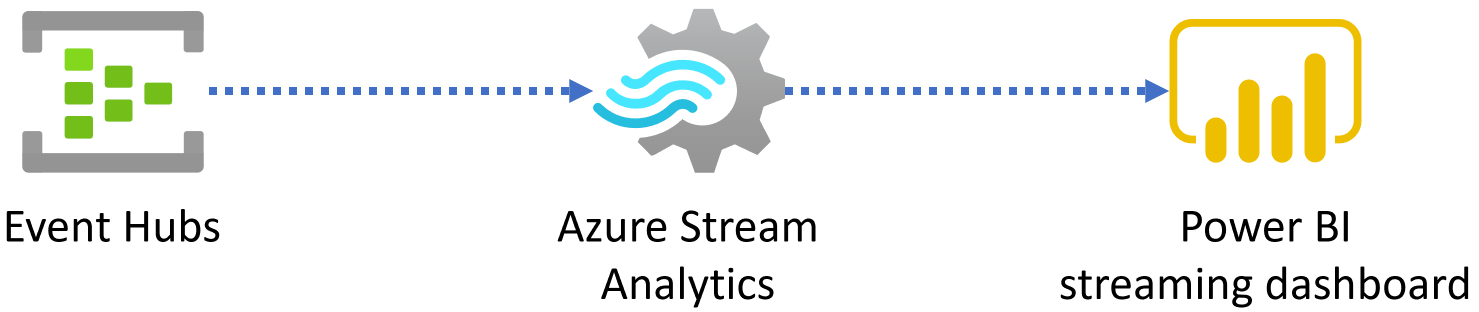
Overview Of Azure Stream Analytics
- Azure Stream Analytics service is recommended for stream analytics on Azure.
- It provides you with the ability to ingest, process, and analyze streaming data from Azure Event Hubs and Azure IoT Hub.
- Azure Stream Analytics is meant for a wide range of cases that include:
- Extract, Transform, Load (ETL)
- Real-time alerts from temporal and spatial patterns or anomalies
- IoT Edge
- Event Sourcing pattern
Note: If you want to learn more about it, check our Azure Stream Analytics blog.
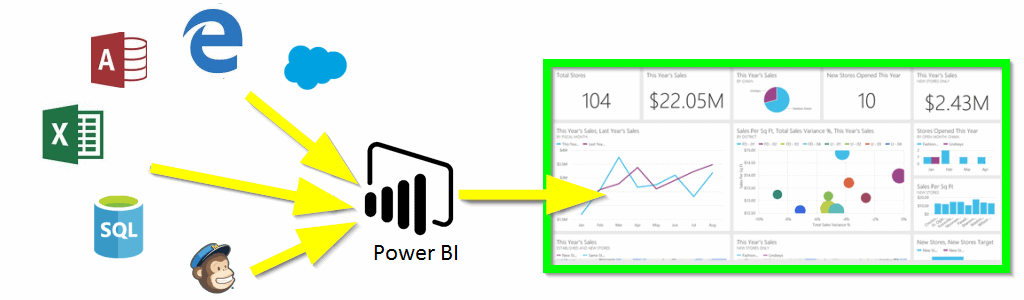
Overview Of Power BI
- Microsoft Power BI is a package of software services, apps, and connectors that sync to turn your unrelated sources of data into coherent, visually immersive, and interactive insights.
- Whether your data is a collection of cloud-based and on-premises hybrid data warehouses or a simple Microsoft Excel workbook, Power BI lets you easily connect to your data sources, clean, and model your data without affecting the underlying source, visualize what’s significant, and share that with anyone or everyone you want.
Note: If you want to learn more about it, check our Power BI blog.
Requirements For Displaying Live Streaming Data Using Power BI Service Are:
- Machine Temperature Application.
- Visual Studio Community Edition to run the application.
- Azure Subscription.
Steps: –
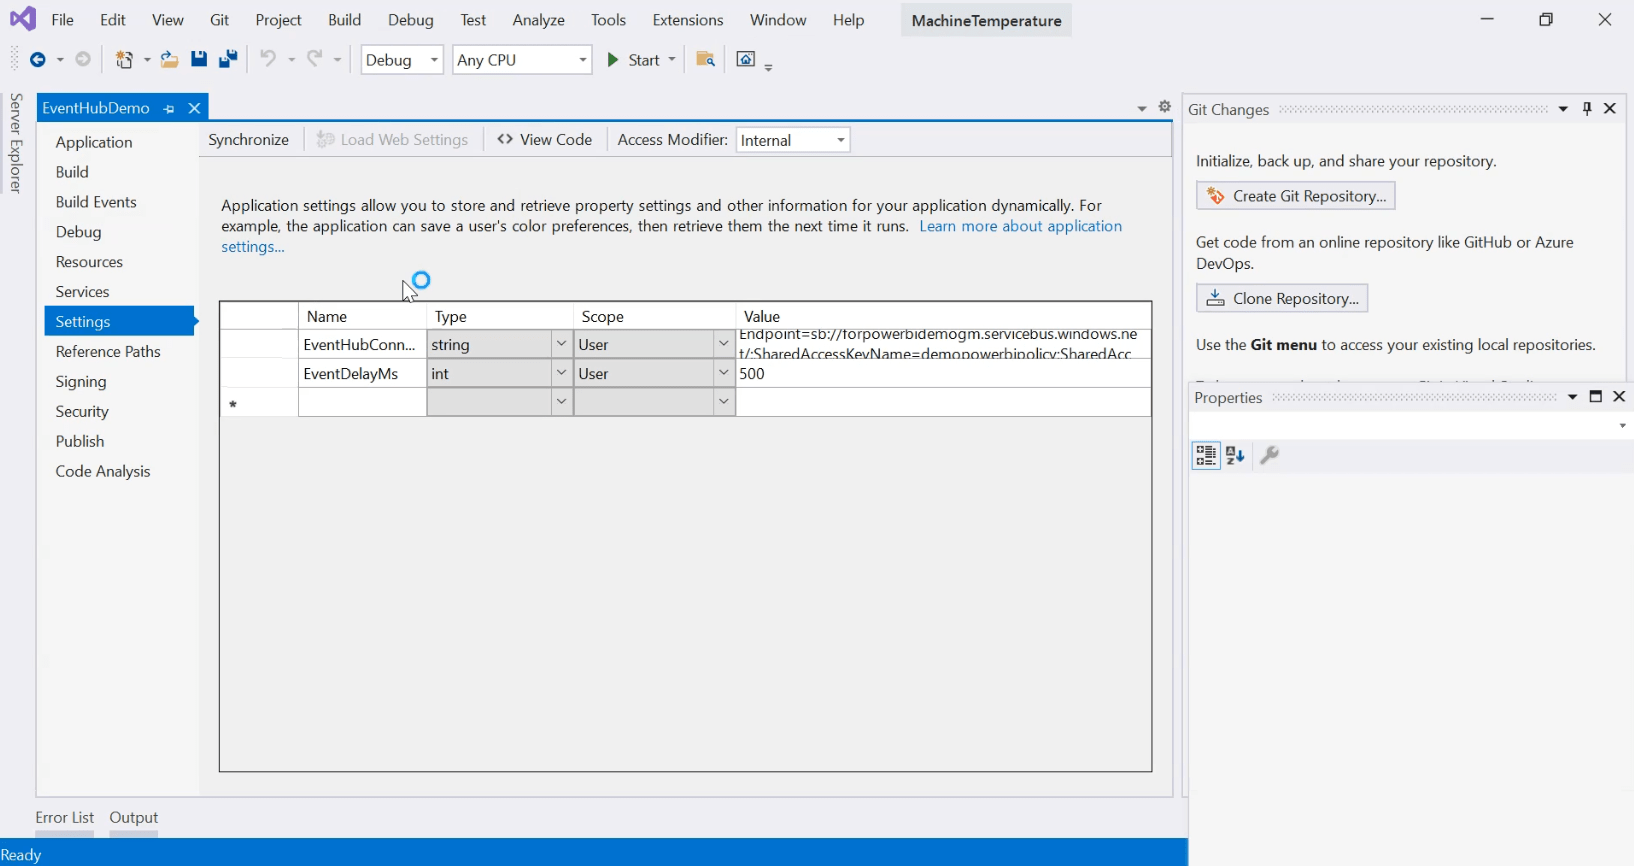
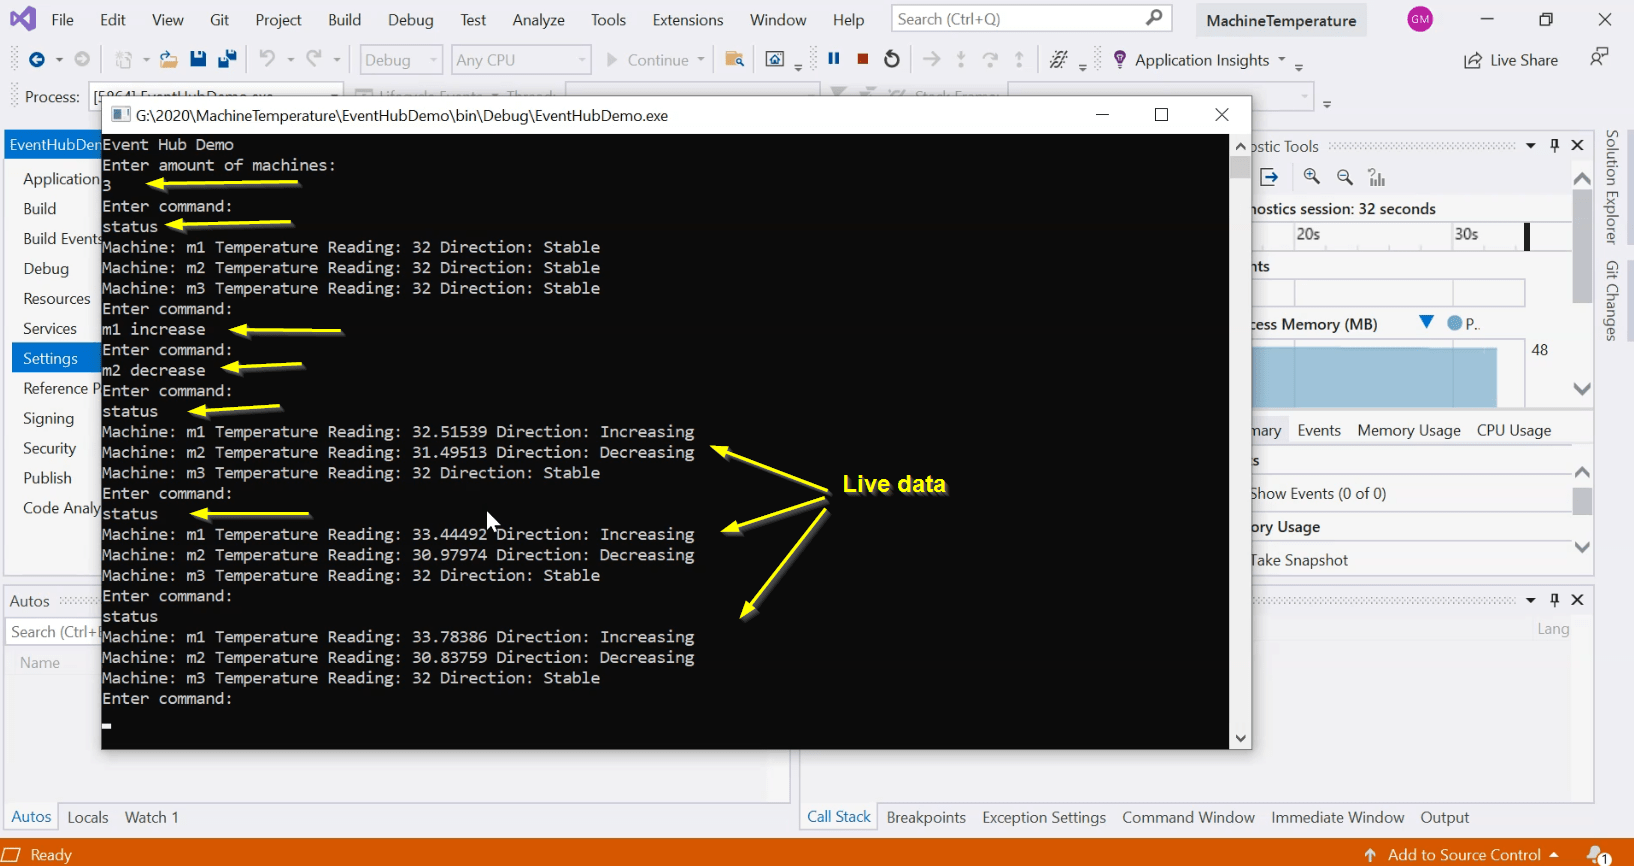
1. Open Machine Temperature Application on visual studio. where we are going to generate the virtual machines, by using them, we’ll be able to generate machines temperature data.
2. Click on start.
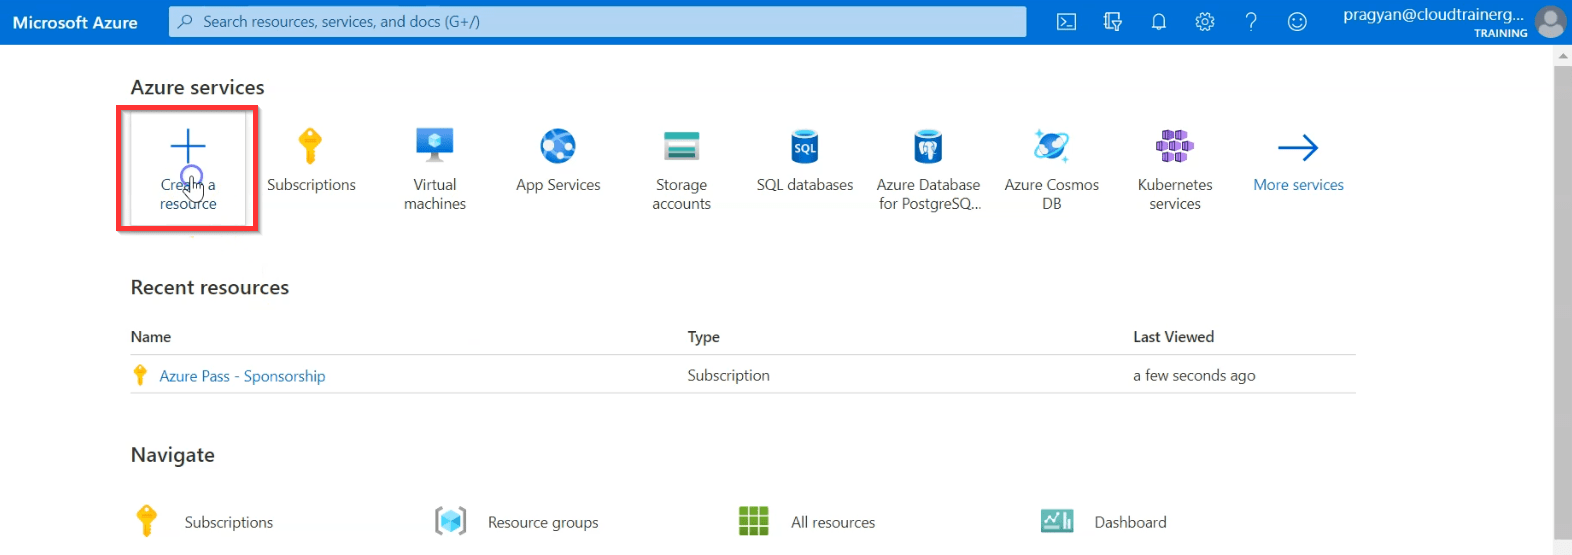
3. Go to the Azure portal, and select Create a resource at the top left of the screen.
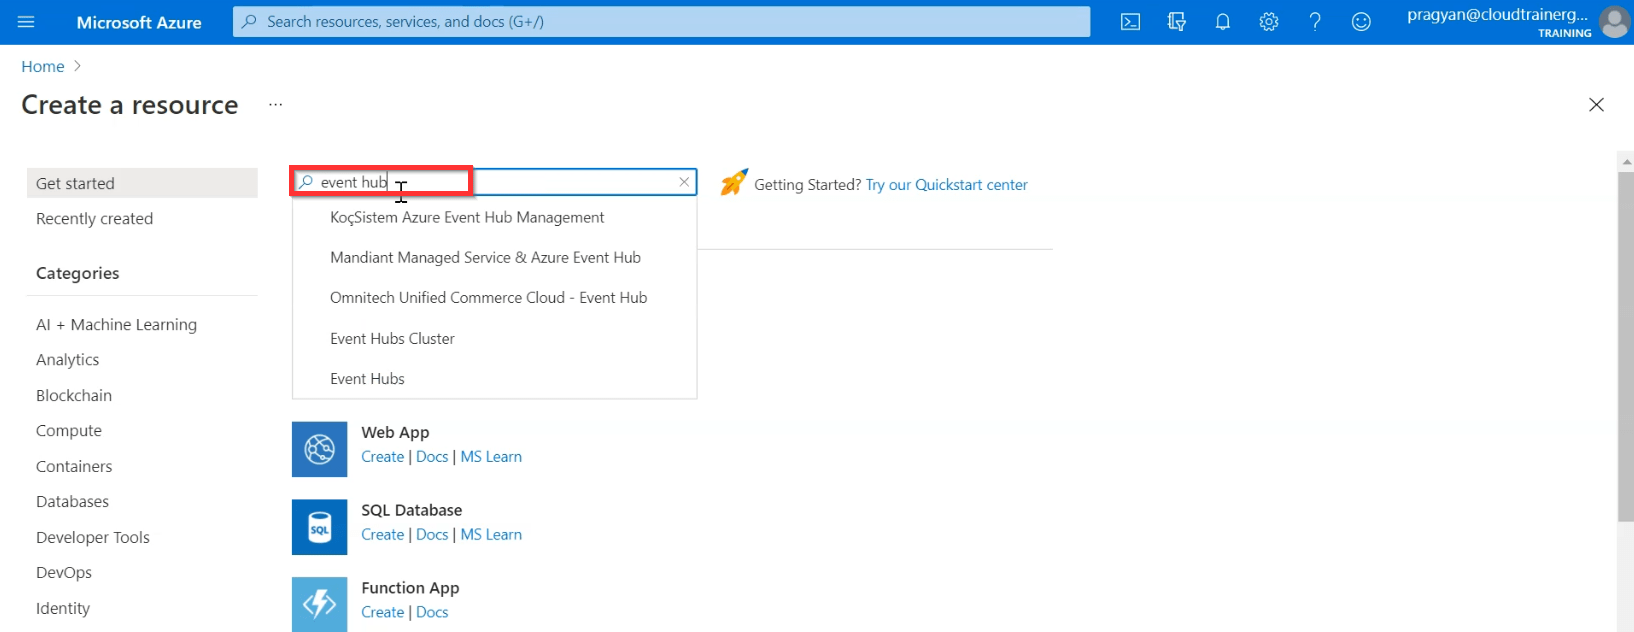
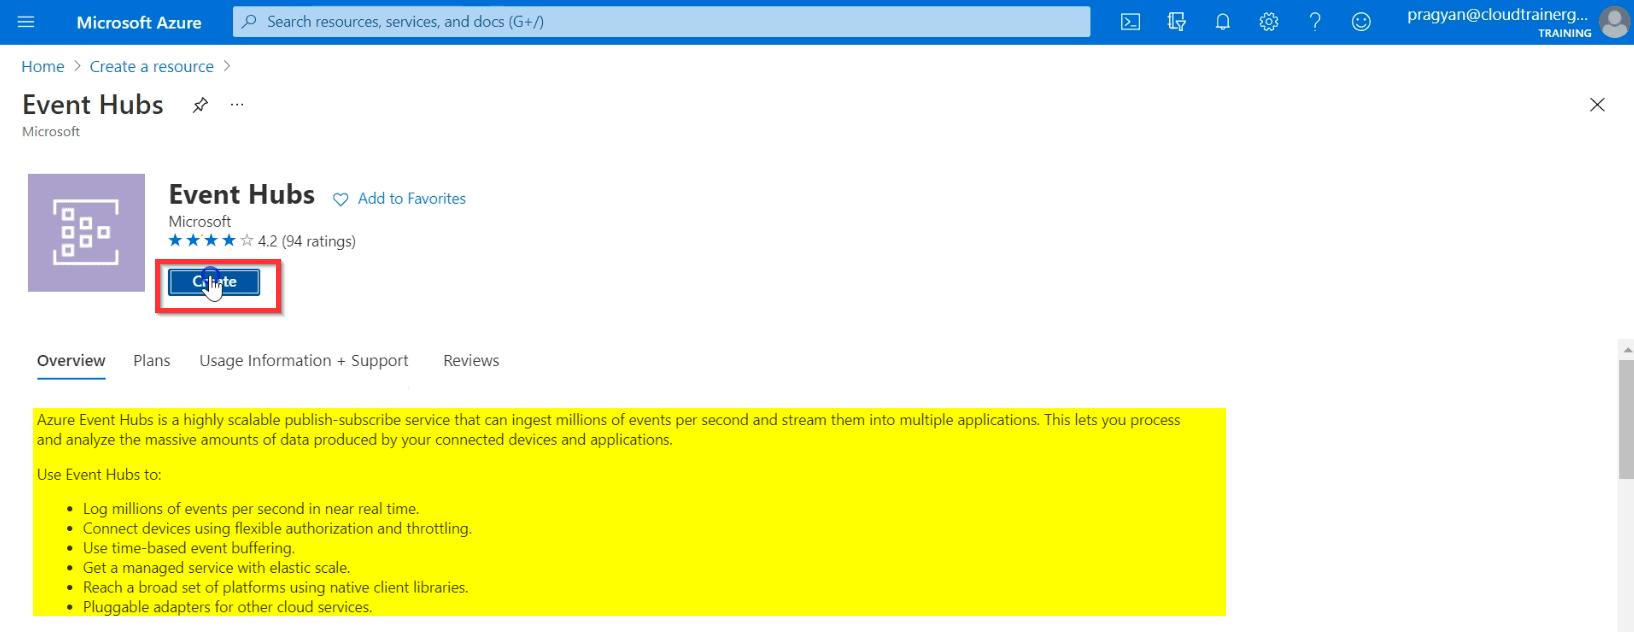
4. On the create resource page, search for Event Hub. Click on Event Hubs.
5. Create Event Hubs.
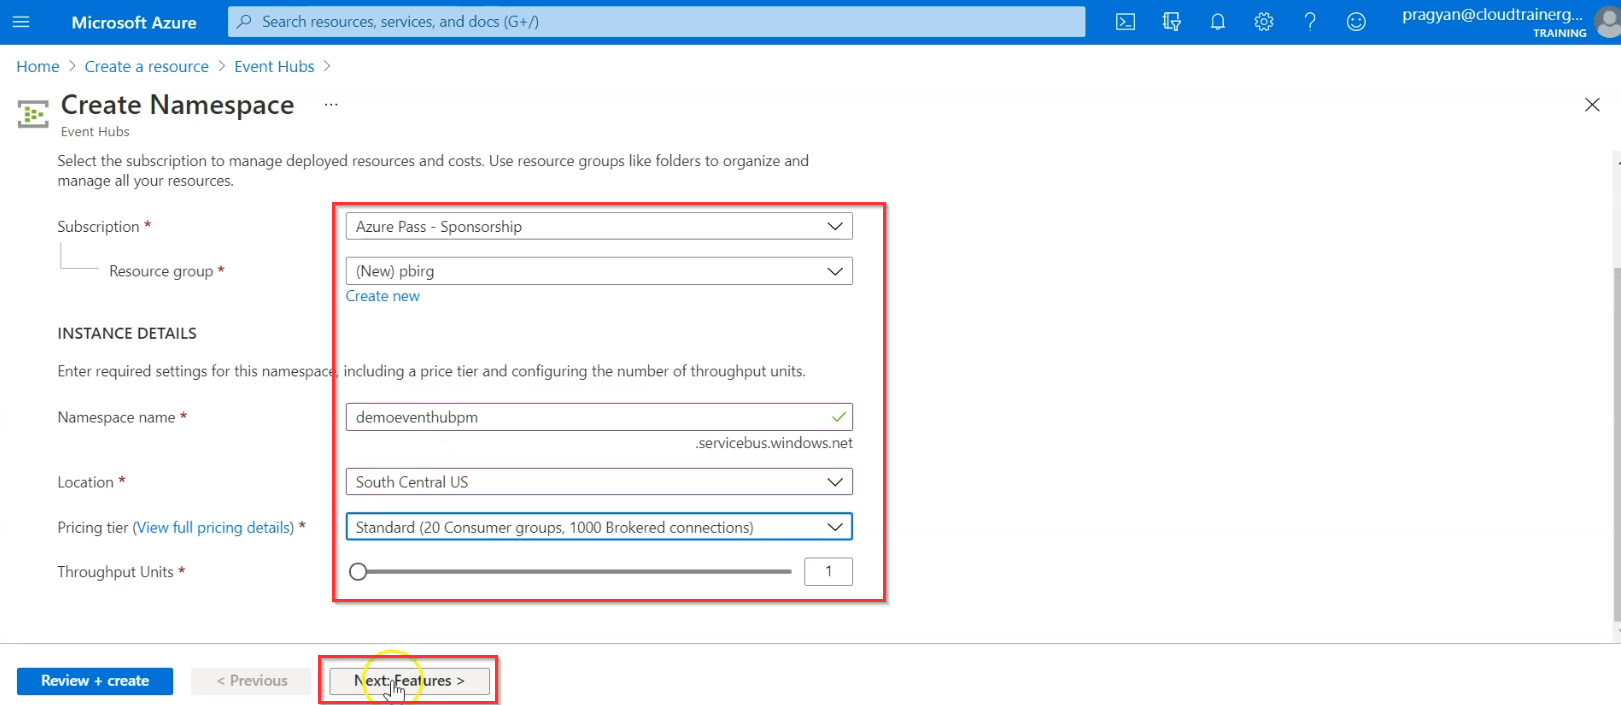
6. On the Create namespace page, fill in the basic details. Click on Review + Create.
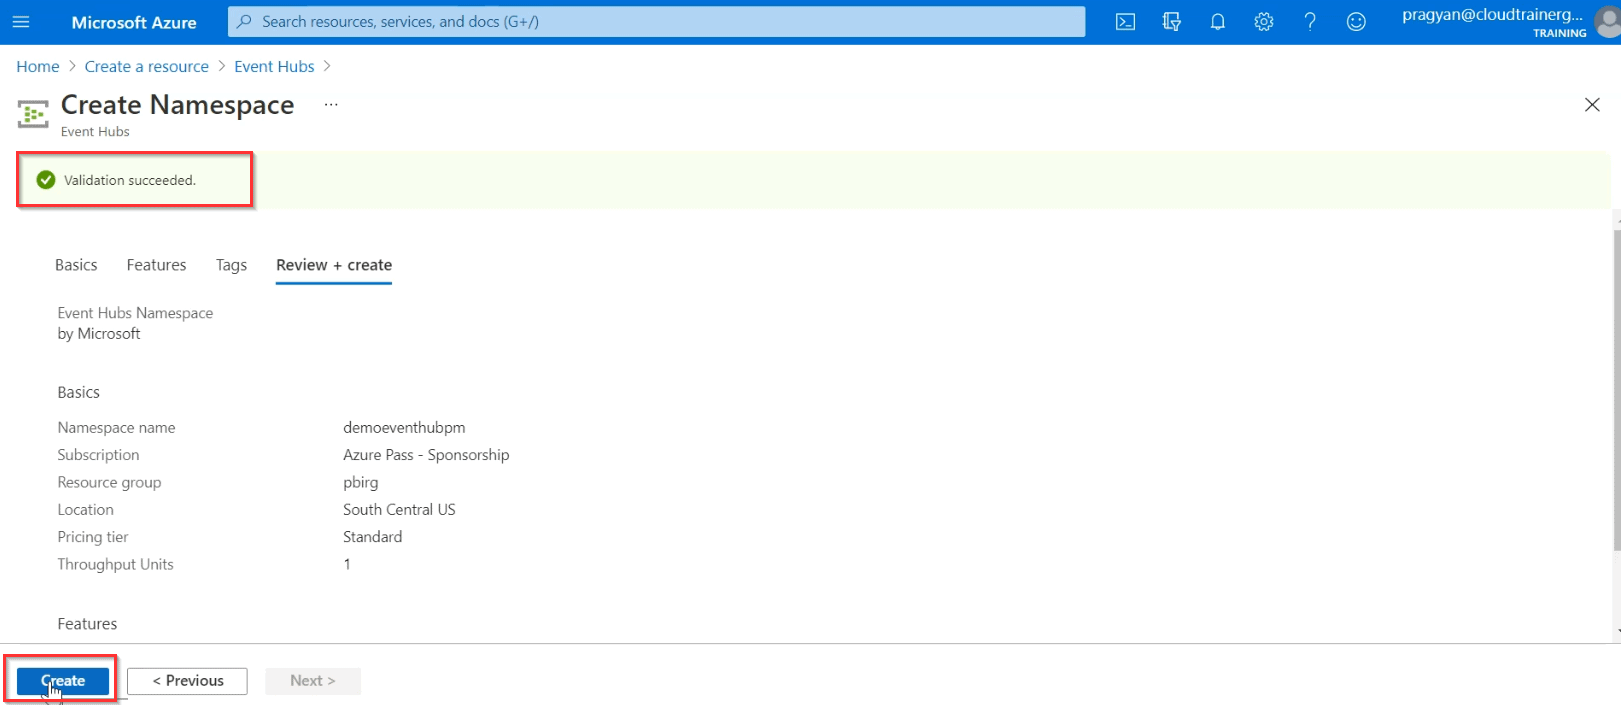
7. On the Review + Create page, select Create. Wait for the deployment to complete.
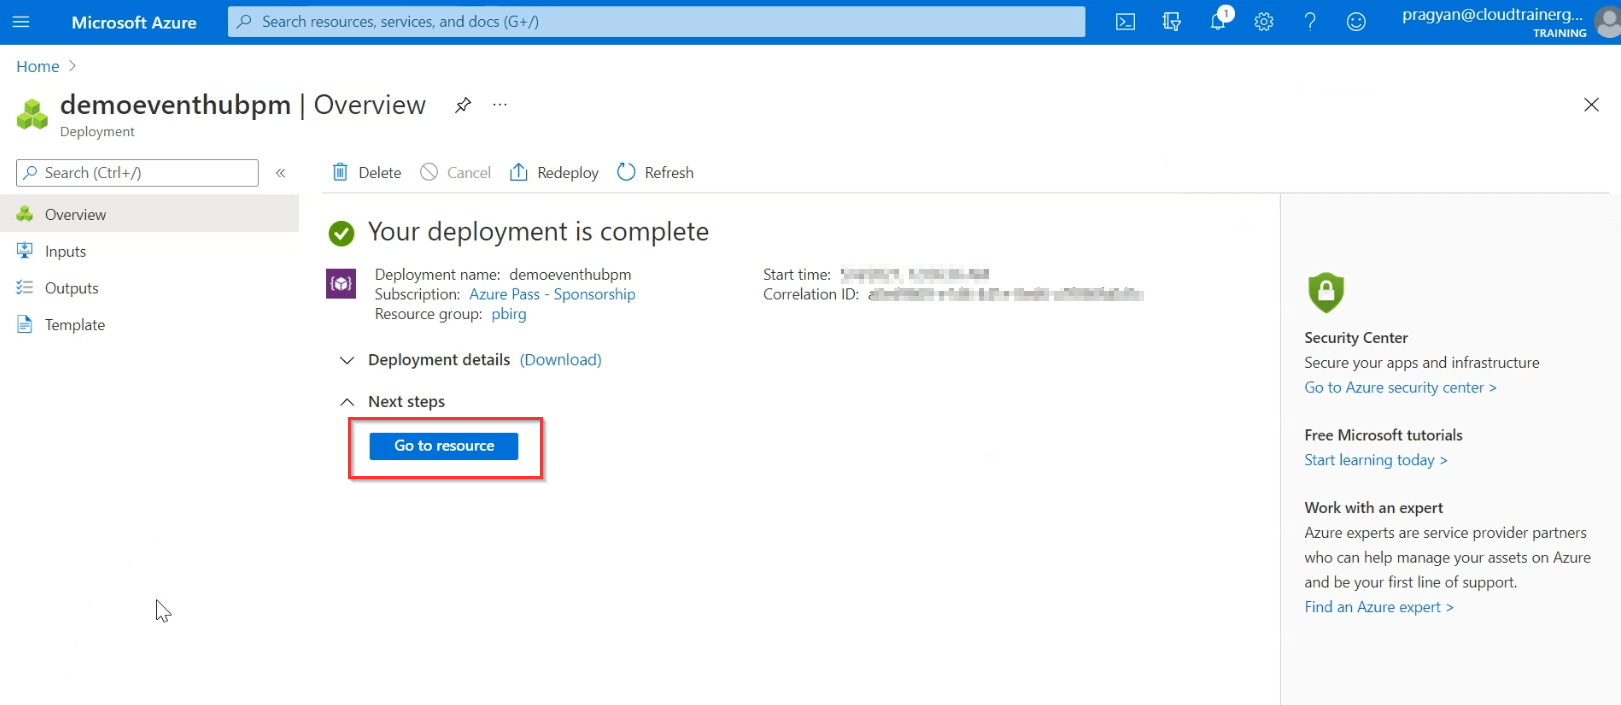
8. On the Deployment page, select Go To Resource.
9. At the top of the window, select + Event Hub.
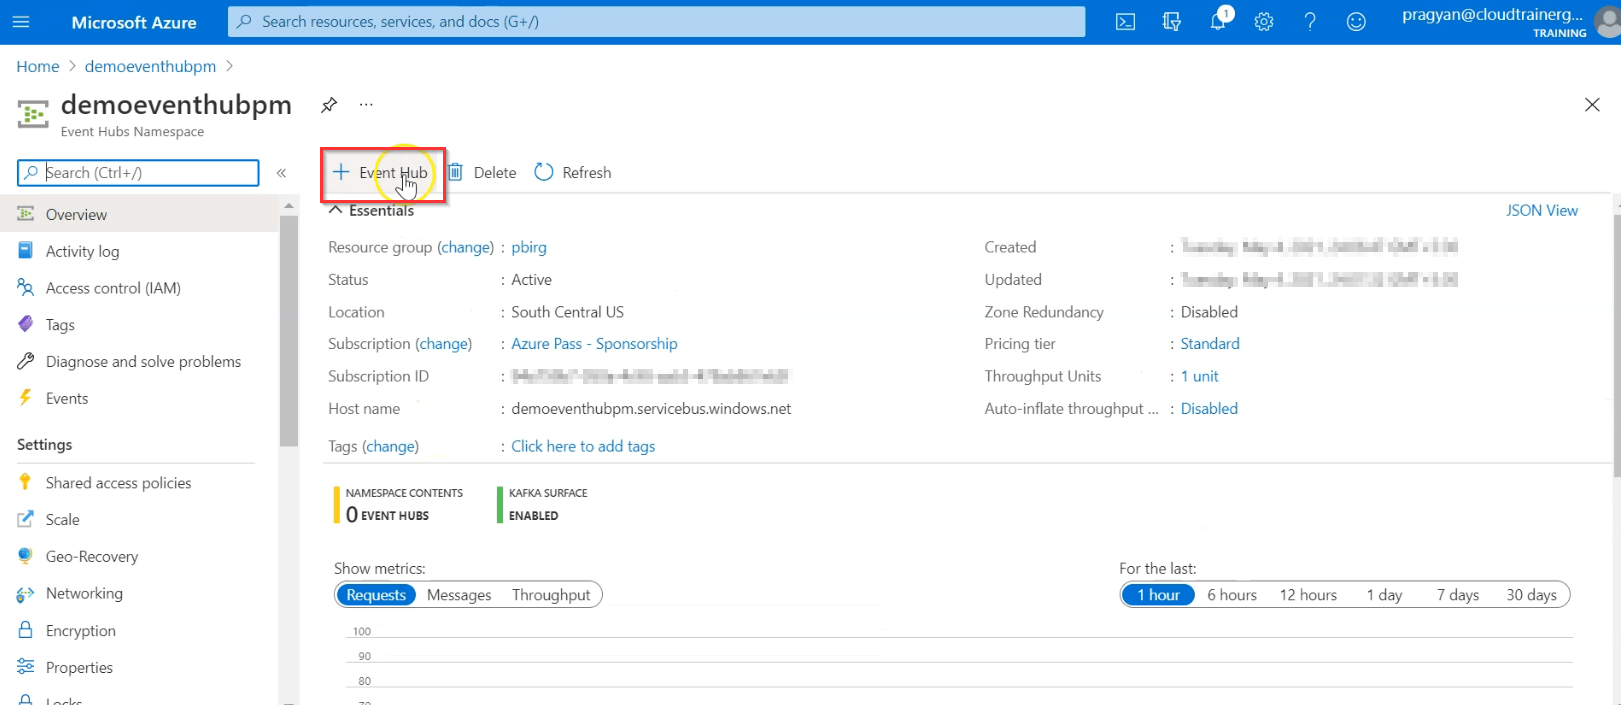
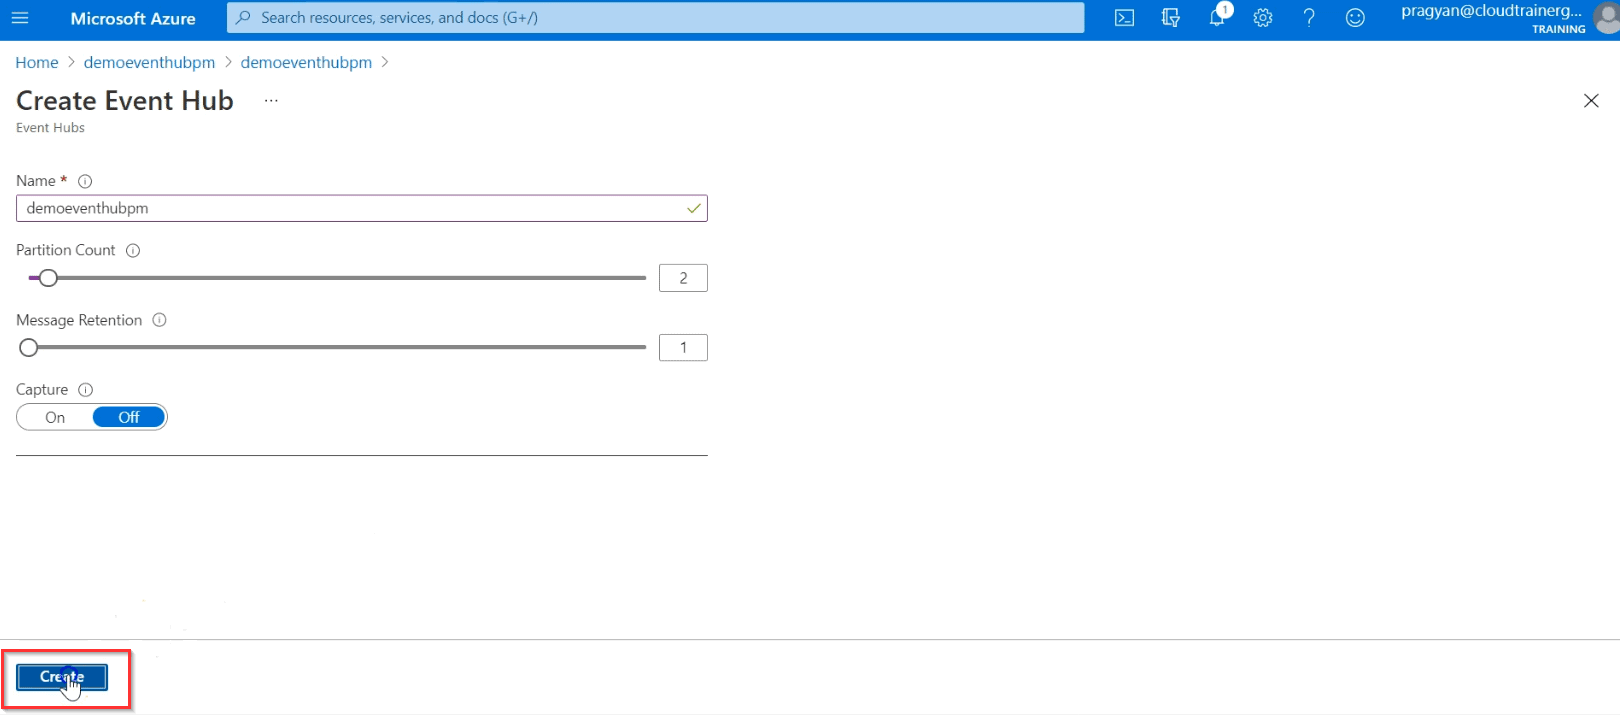
10. Type a name for your event hub, then select Create.
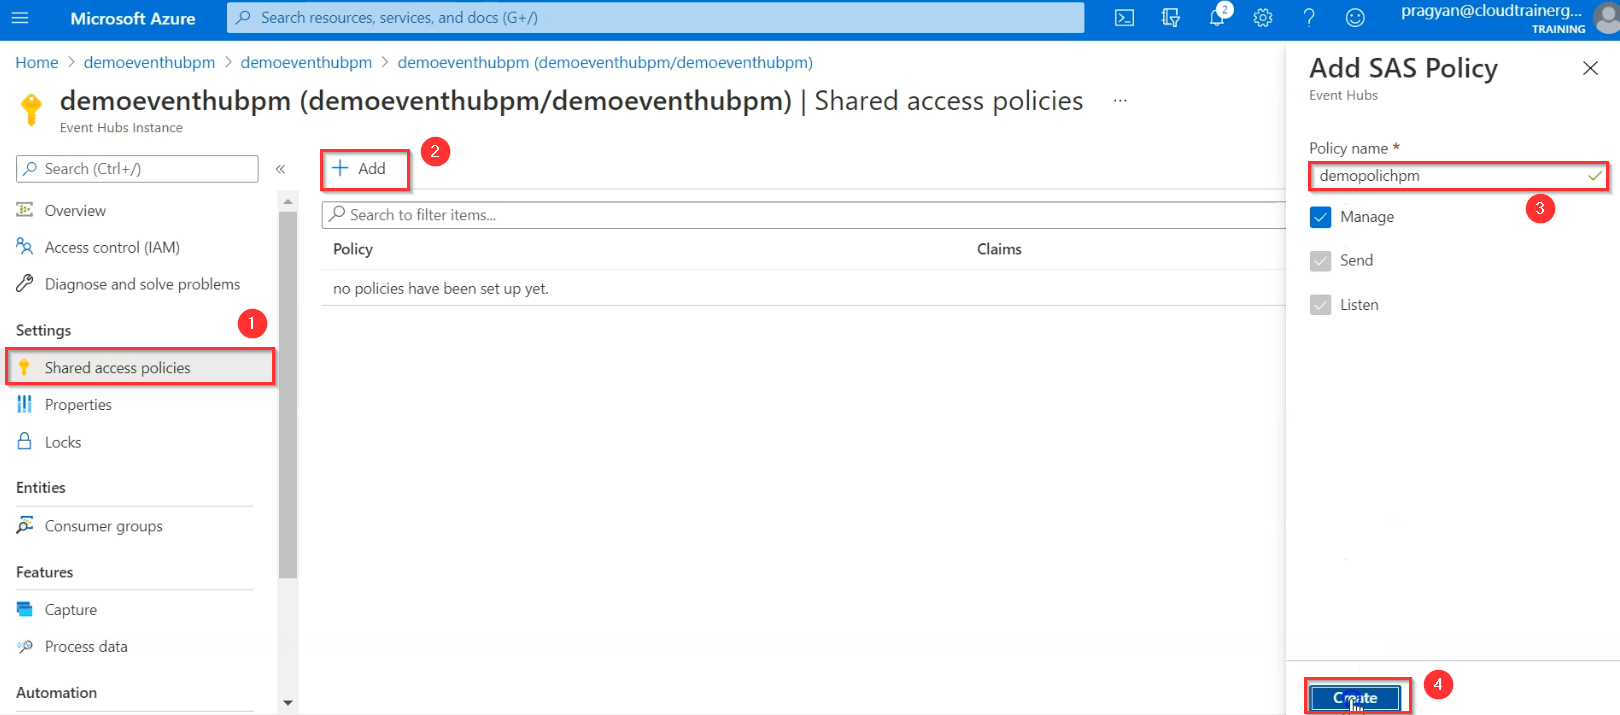
11. Click on the Event hub name to grant access to the event hub, in the blade under the section settings on the left click Shared access policies. Click on Add. Enter policy name, select manage, and then click on create.
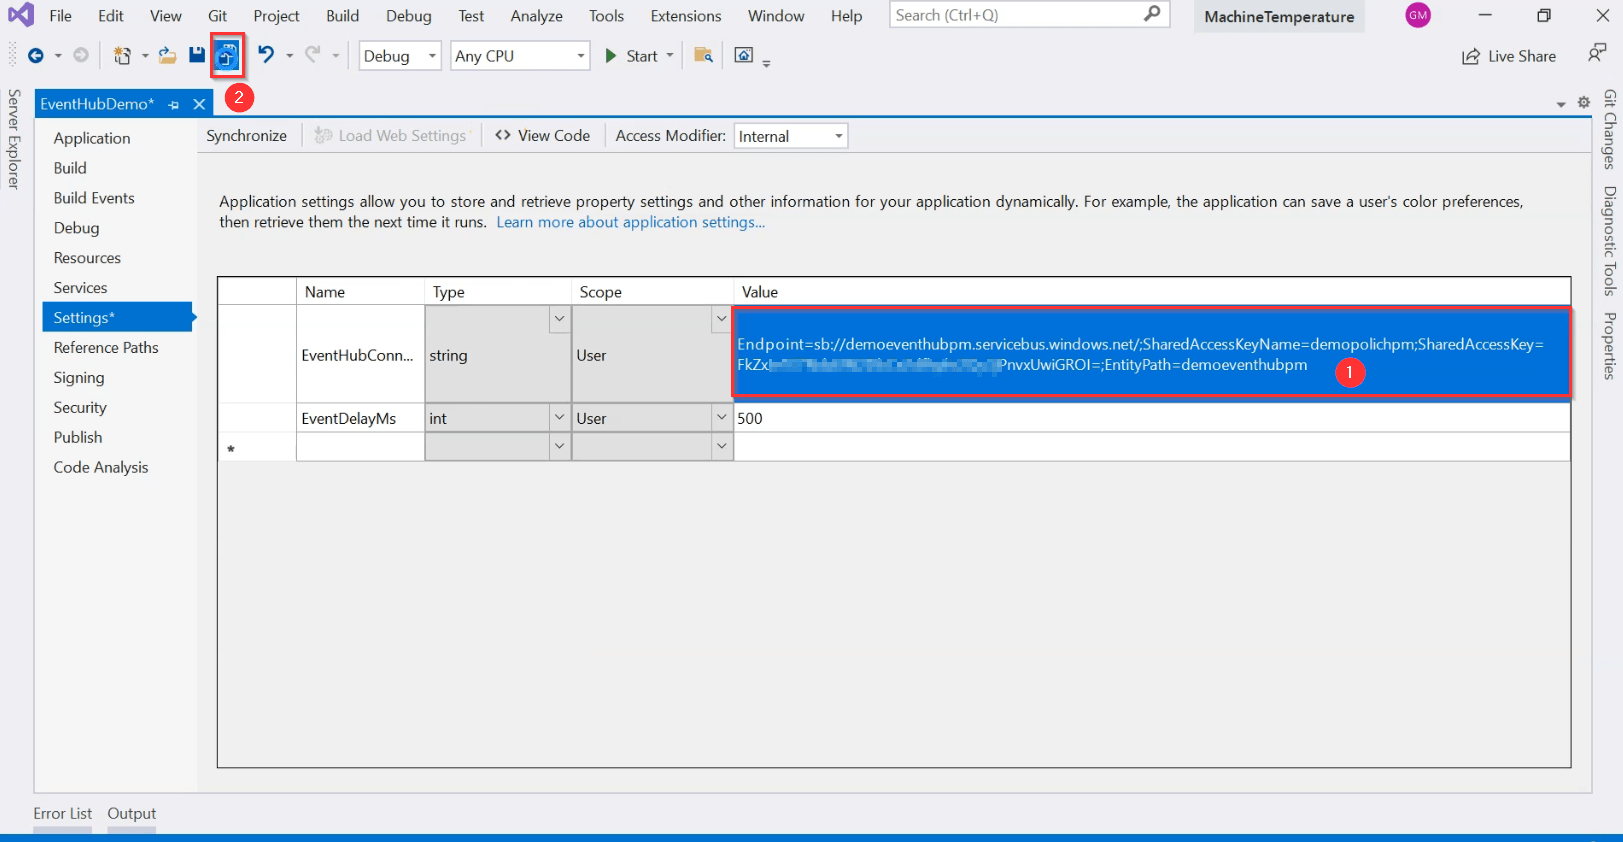
12. Click on your new policy after it has been created, and then select the copy button for the CONNECTION STRING – PRIMARY KEY.
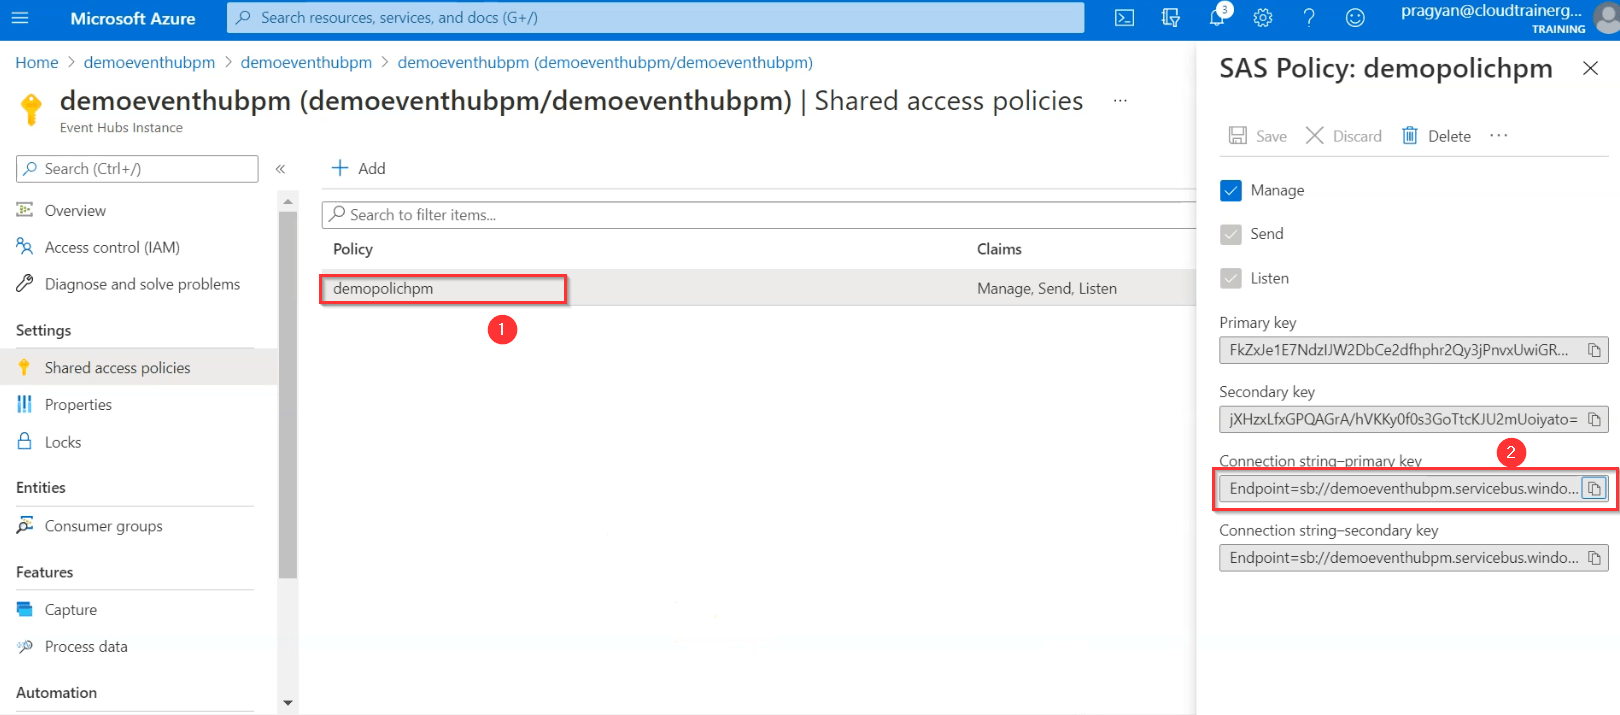
13. Copy this connection string in vs-code in the value column and then save it. Once it is saved then start the application.
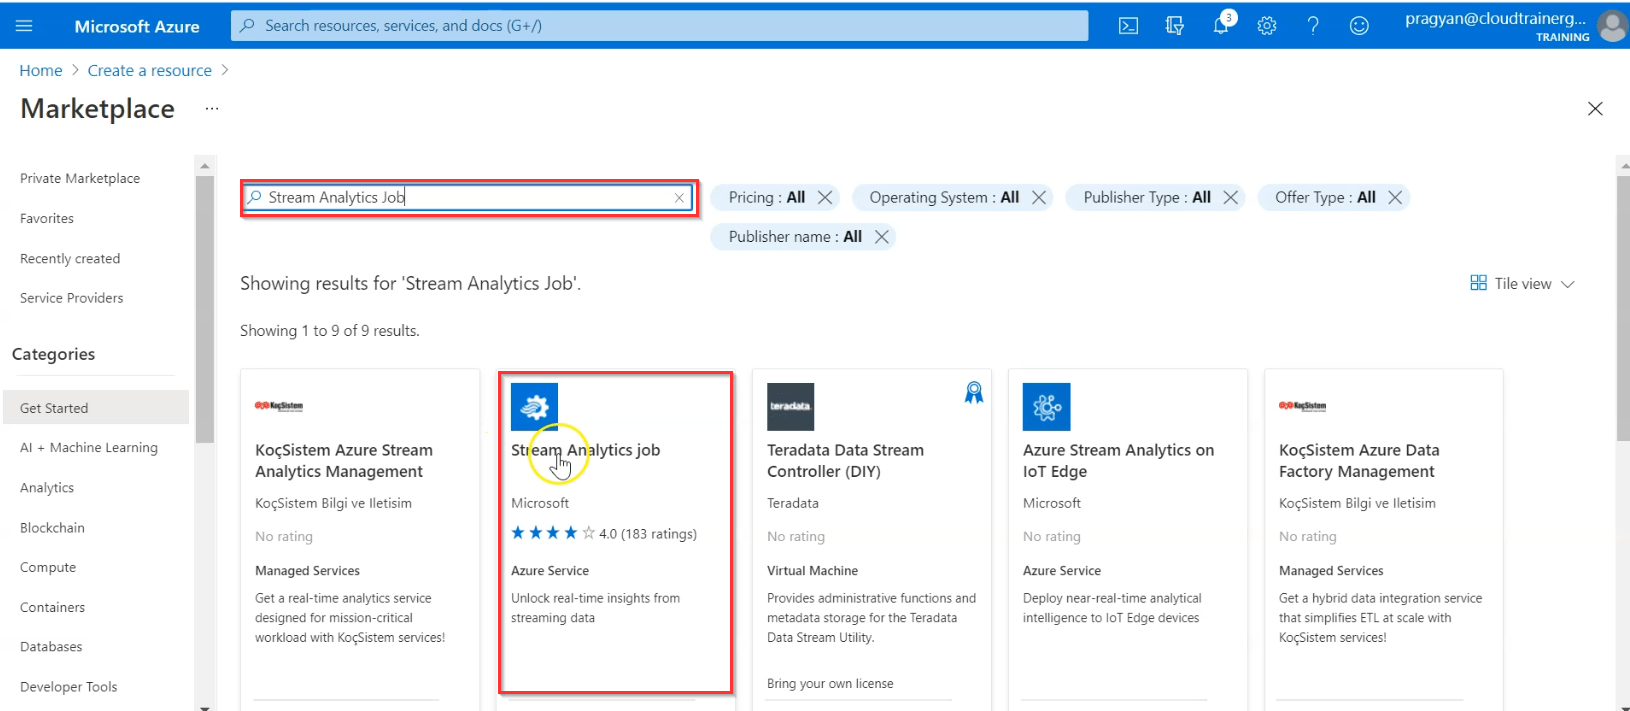
14. Go back to the Azure portal, navigate and click on the + Create a resource icon, type STREAM, and then click the Stream Analytics Job, and then click Create.
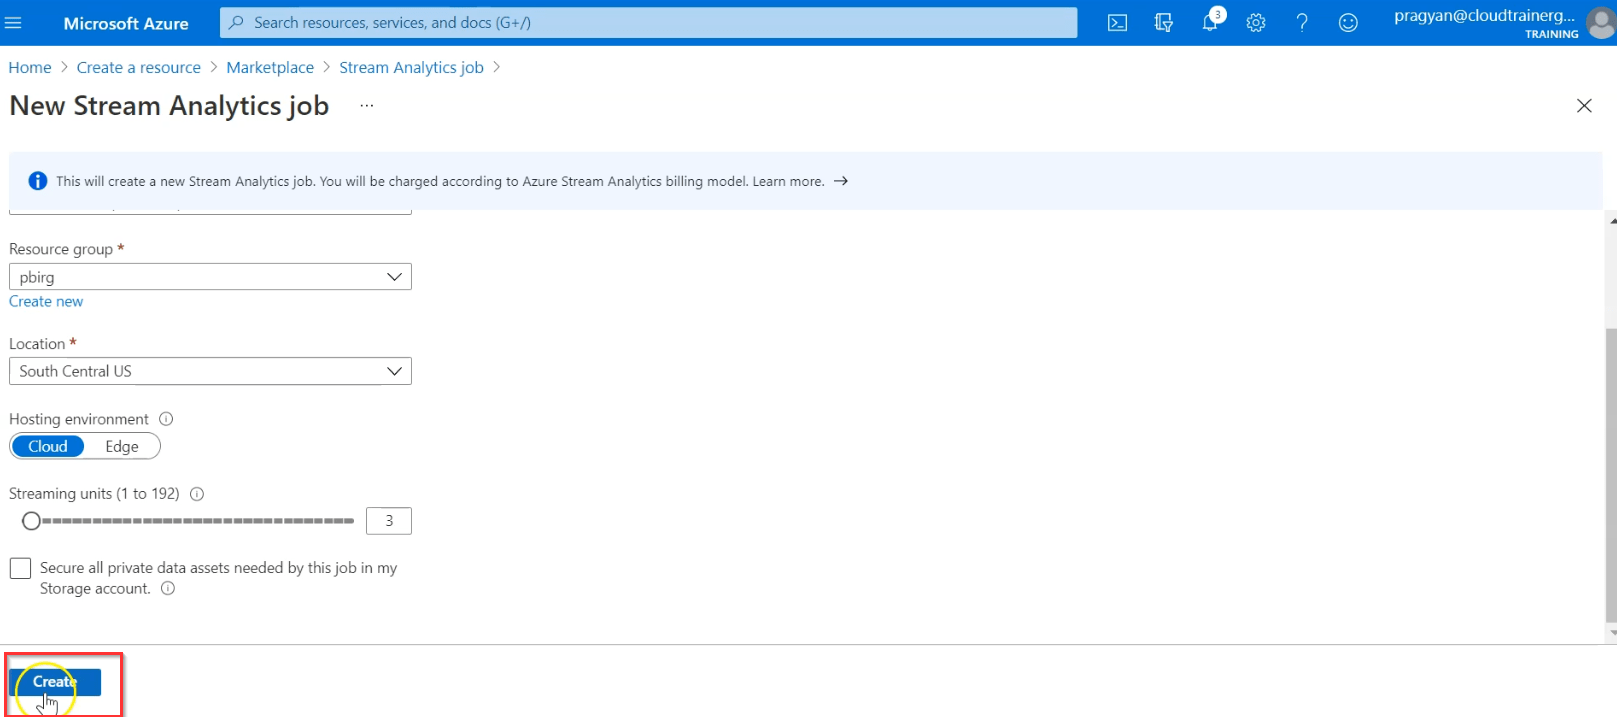
15. In the New Stream Analytics job screen, fill out the following details and then click on Create:
- Job name
- Subscription
- Resource group
- Location
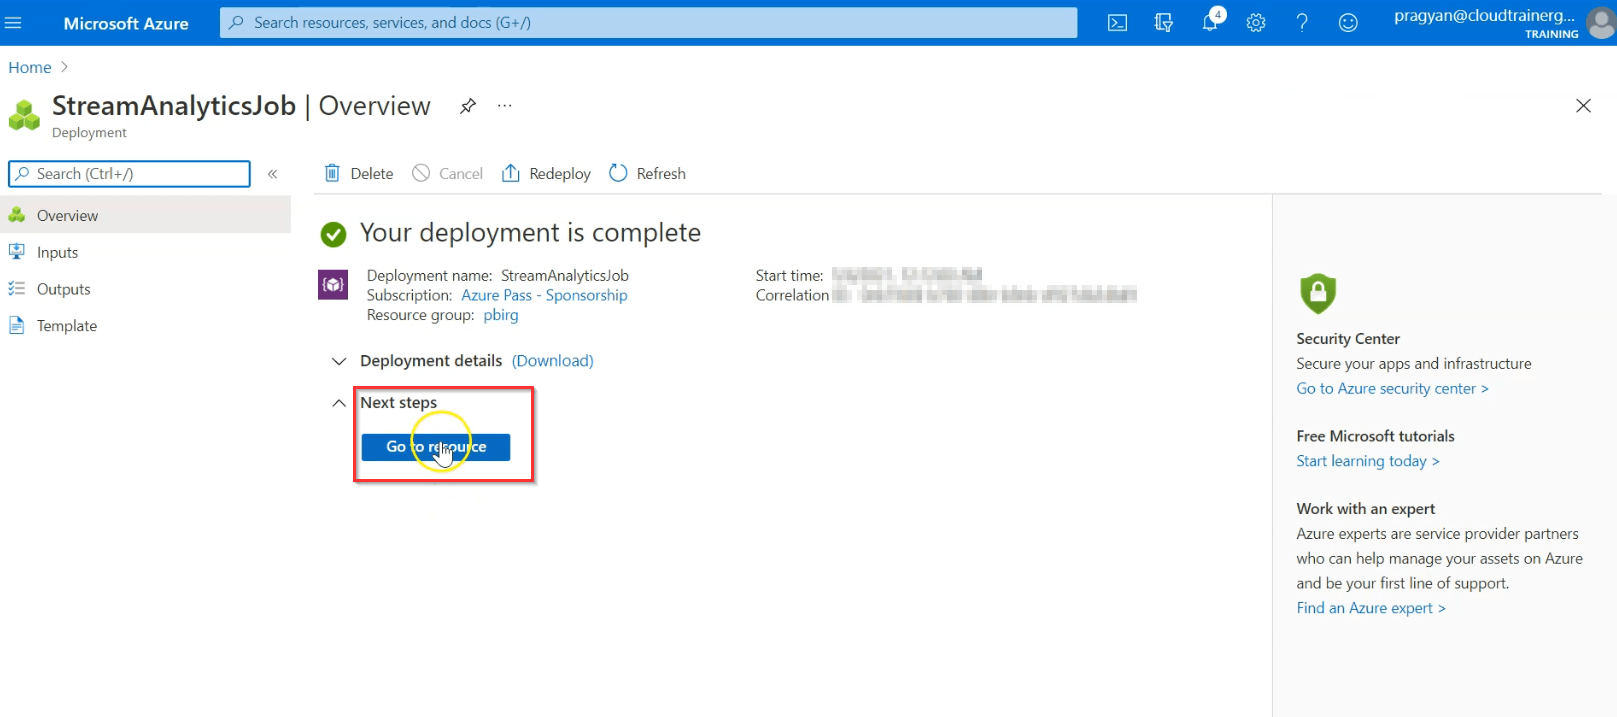
16. Once the stream analytics job is deployed click on Go to Resource.
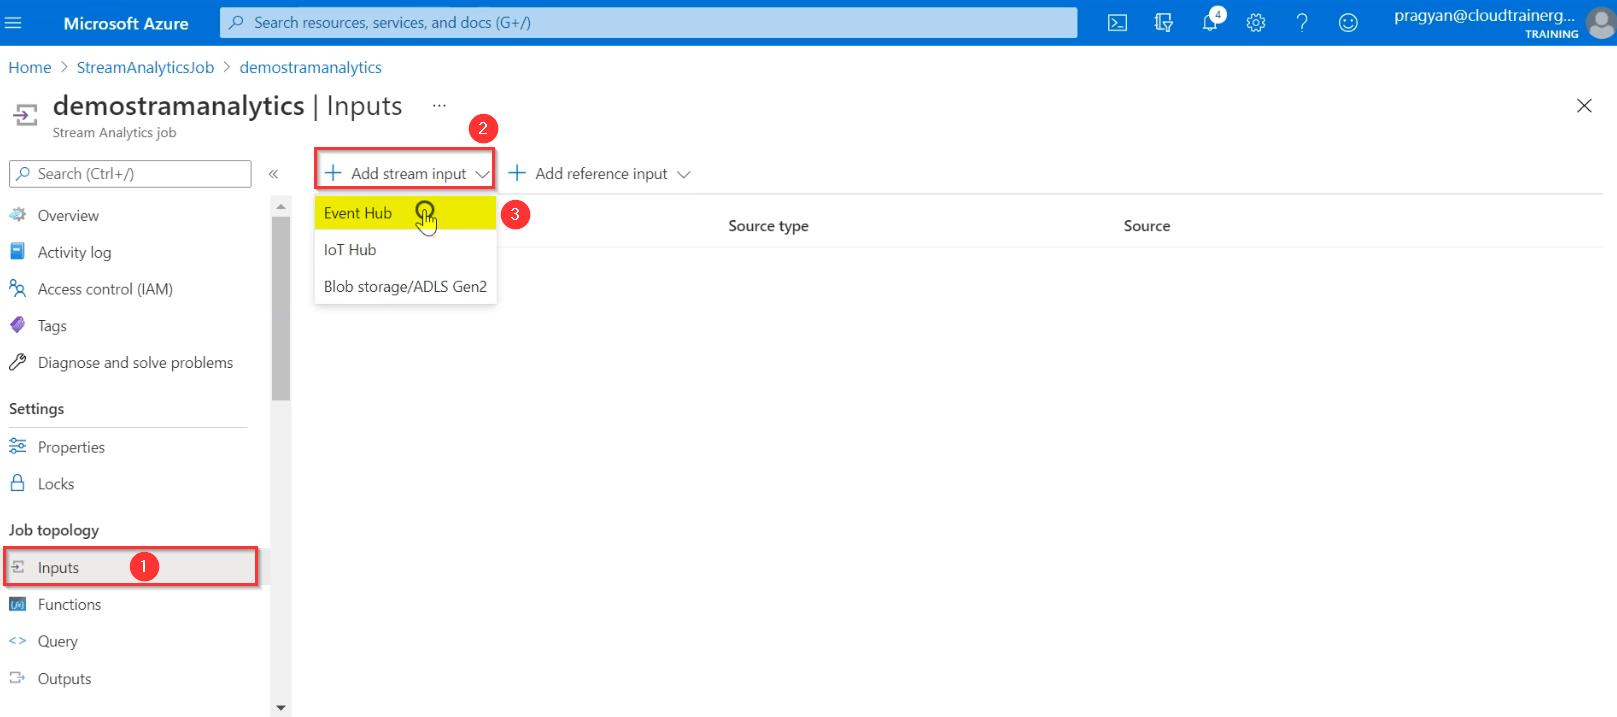
17. In the Inputs screen, click + Add stream input, and then click Event Hubs.
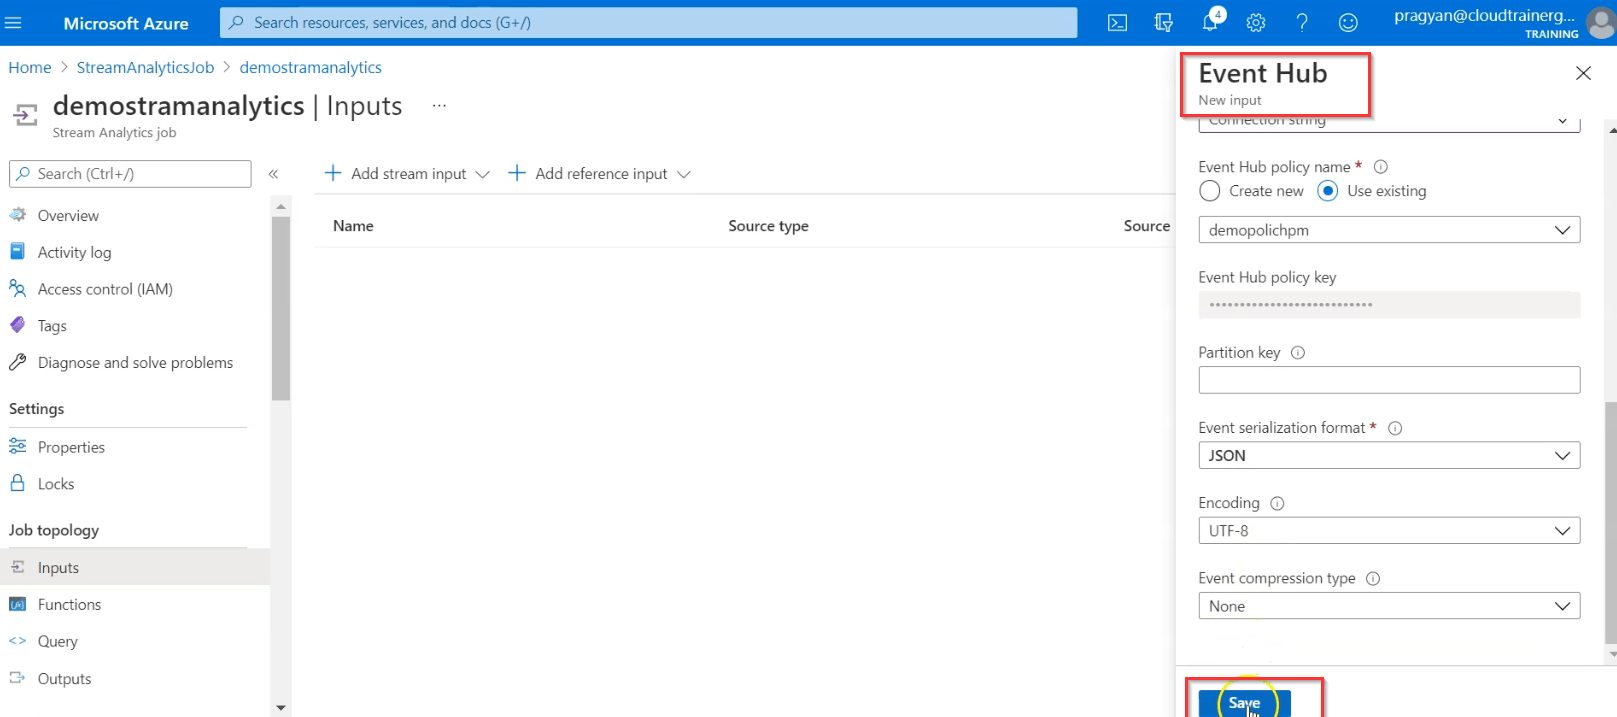
18. Event Hub screen, type in the following values and click the Save button.
- Input alias
- Select Event Hub from your subscriptions
- Subscription
- Event Hub Namespace
- Event Hub Name
- Event Hub Consumer Group
- Authentication Method
- Event Hub Policy Name
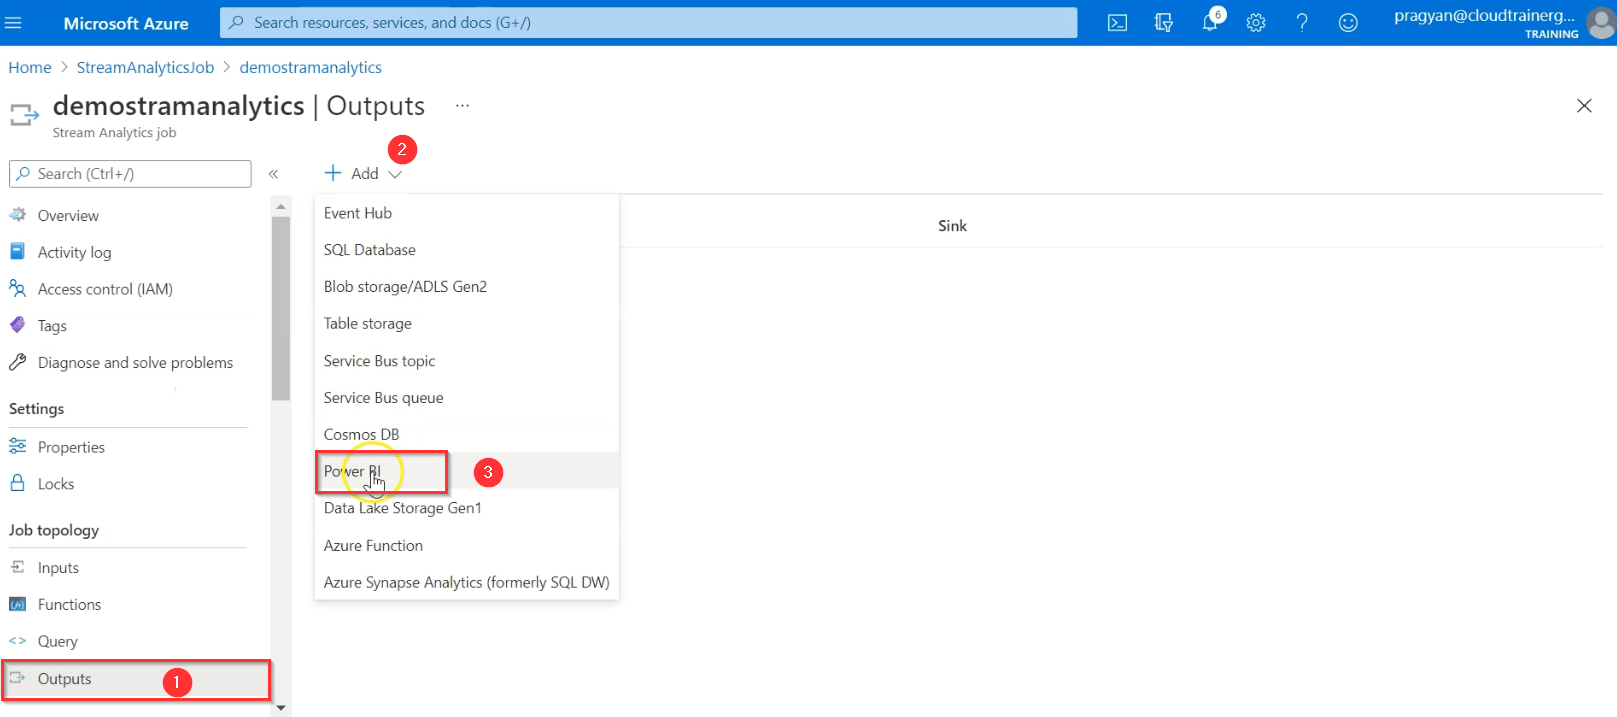
19. In the Outputs screen, click + Add, and then click Power BI.
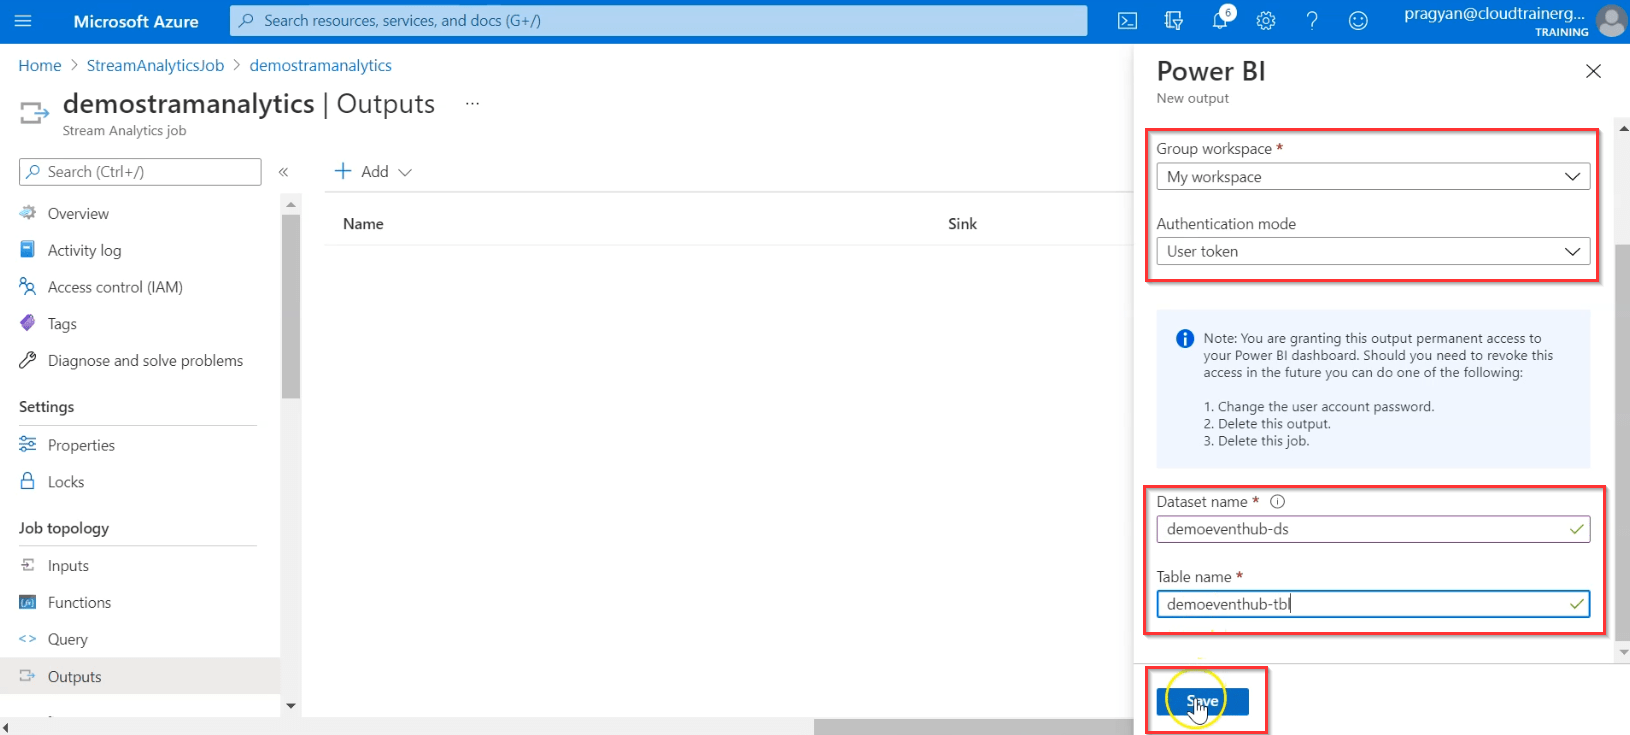
20. Give credentials of Powerbi.com account by clicking on Authorize and give workspace name, Authentication mode, dataset, and table name for RealTIME data. Click on Save.
21. In your stream analytics job window, in the Query screen in the middle of the window, click on Edit query, Save the below code.
SELECT max(temperatureReadTimestamp) as WindowEnd,
    avg(temperature) as averageTemperature,
    stdevp(temperature) as stdeviationTemperature,
    max(temperature) as maxTemperature,
    min(temperature) as minTemperature,
    machineName
Into PowerBIOutput
FROM
    InputStream TIMESTAMP BY temperatureReadTimestamp
    GROUP BY TUMBLINGWINDOW(s, 1), machineName
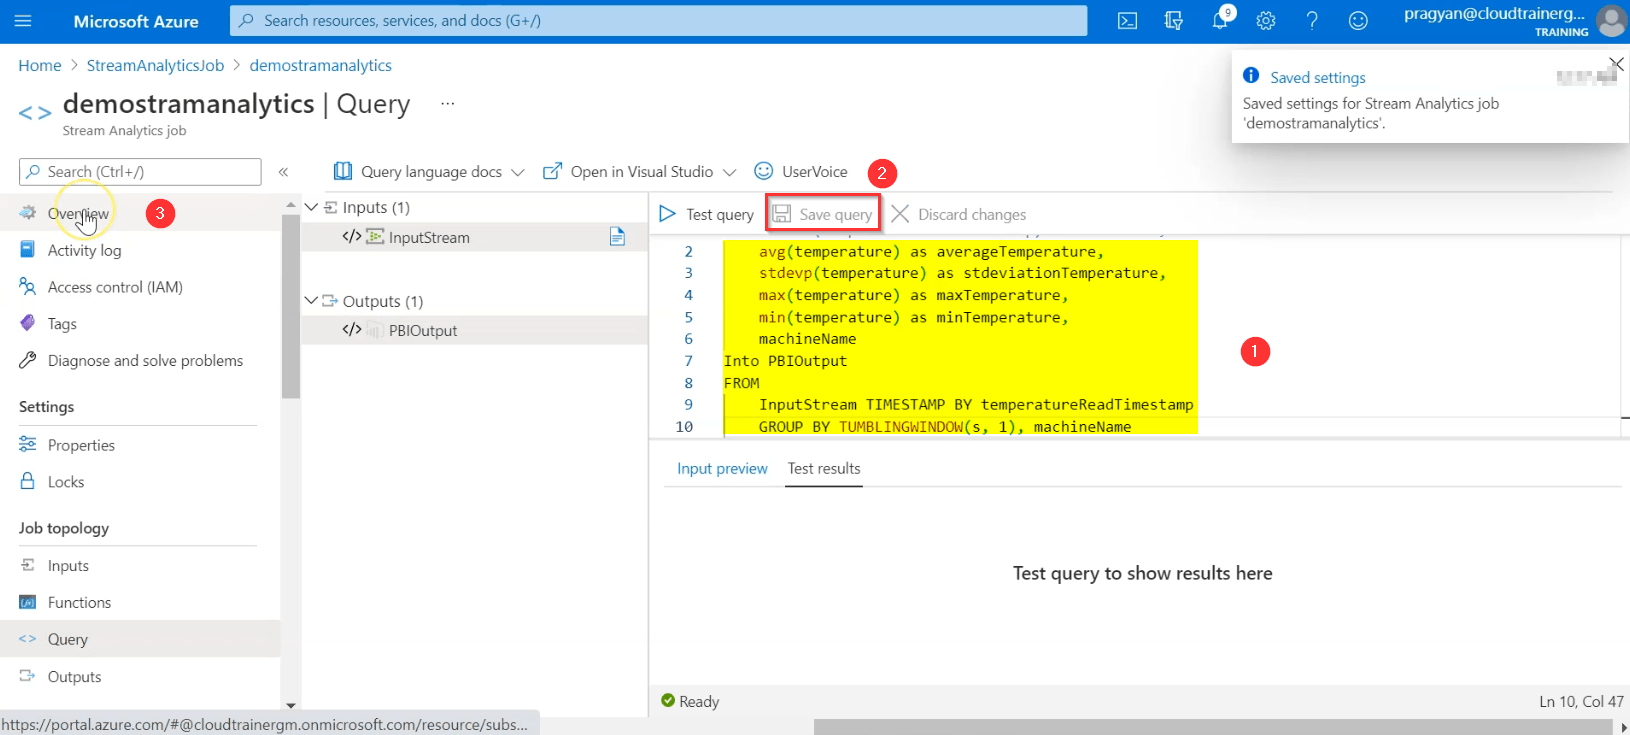
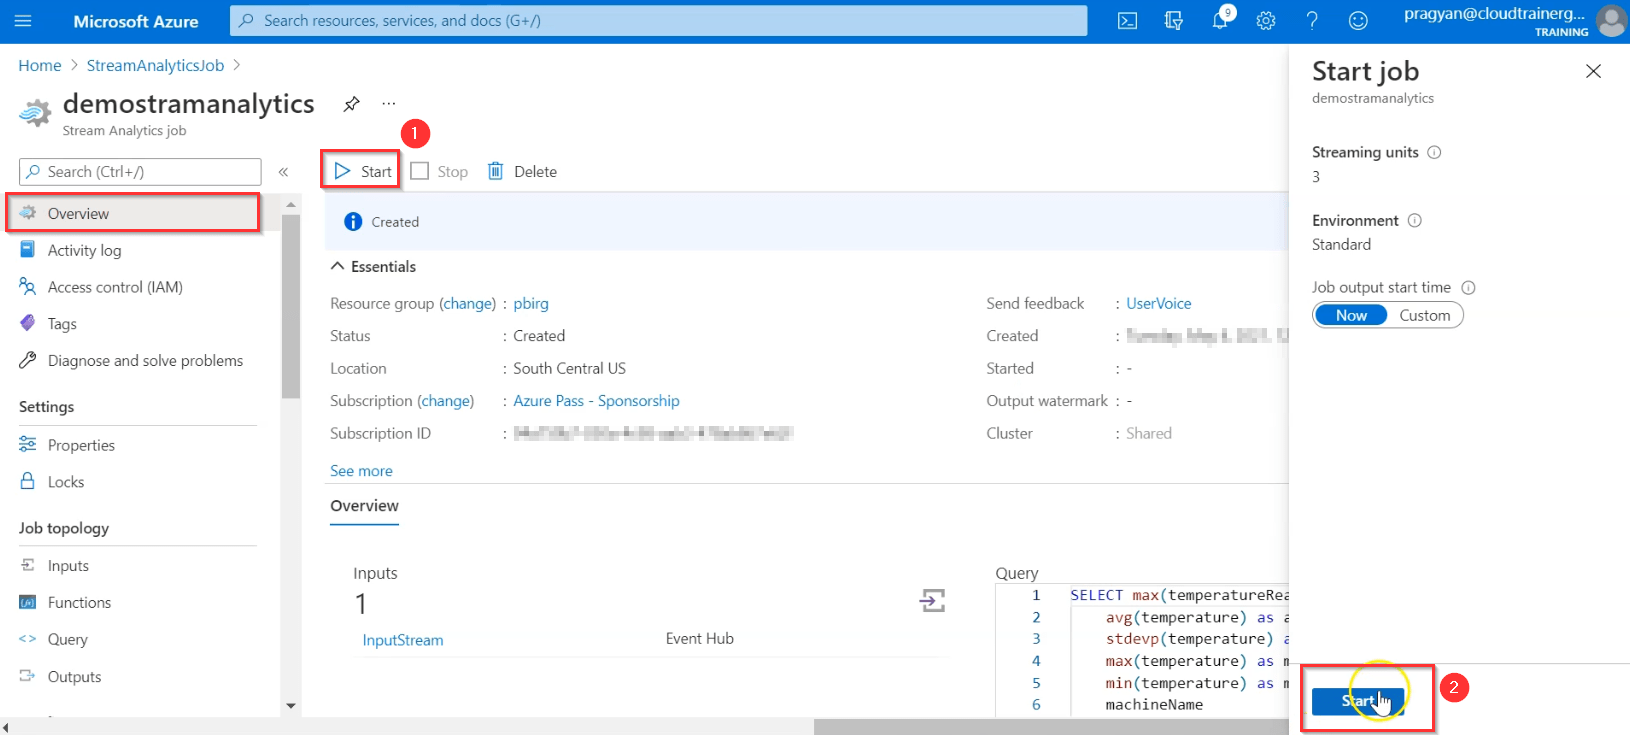
21. Start stream analytics job.
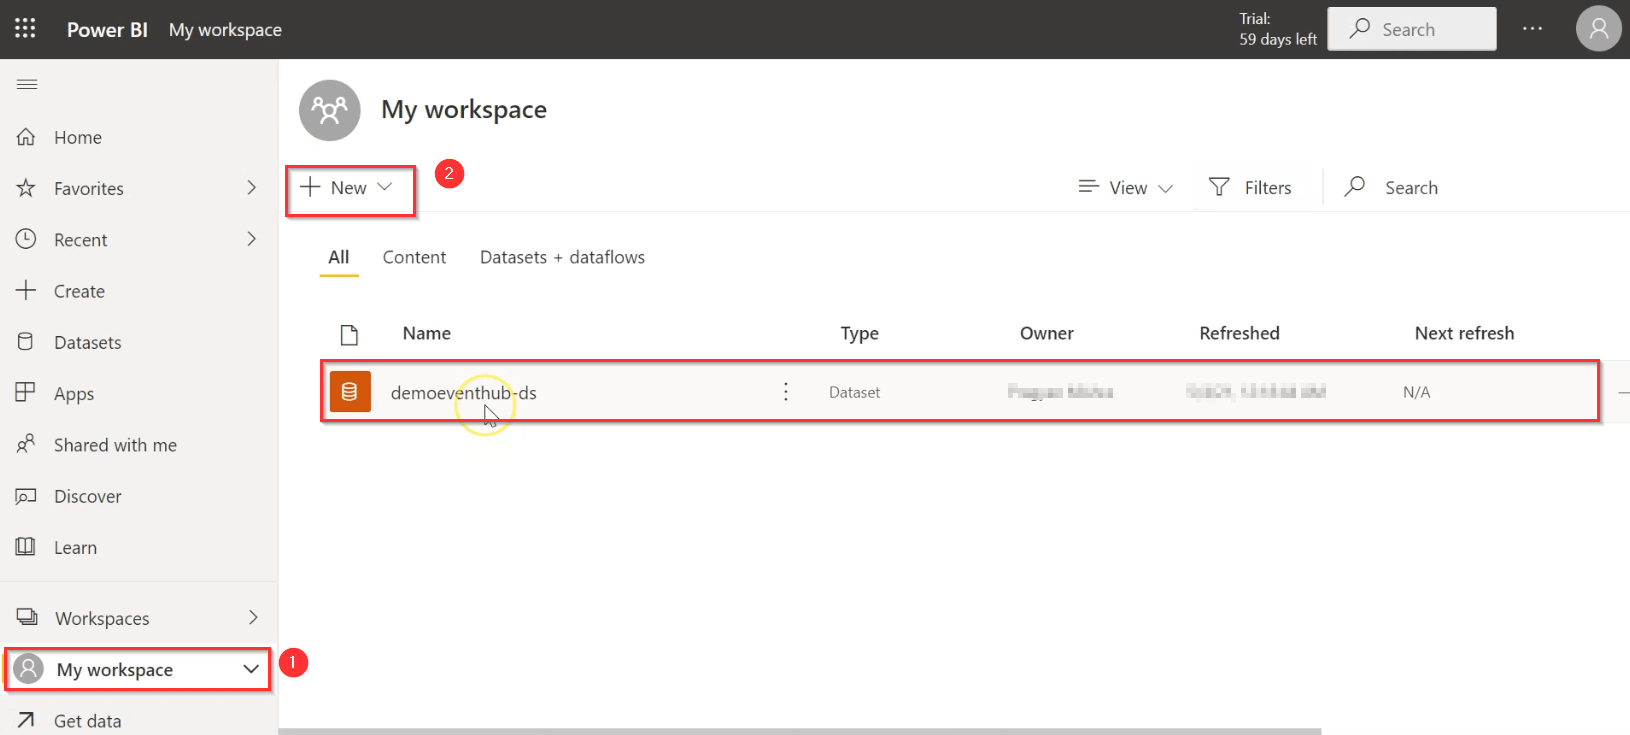
22. Open PowerBI.com and sign in with your account. Go to My Workspace and select Datasets. You can see a Real-time Data Stream dataset is created. Click on new to create a new dashboard.
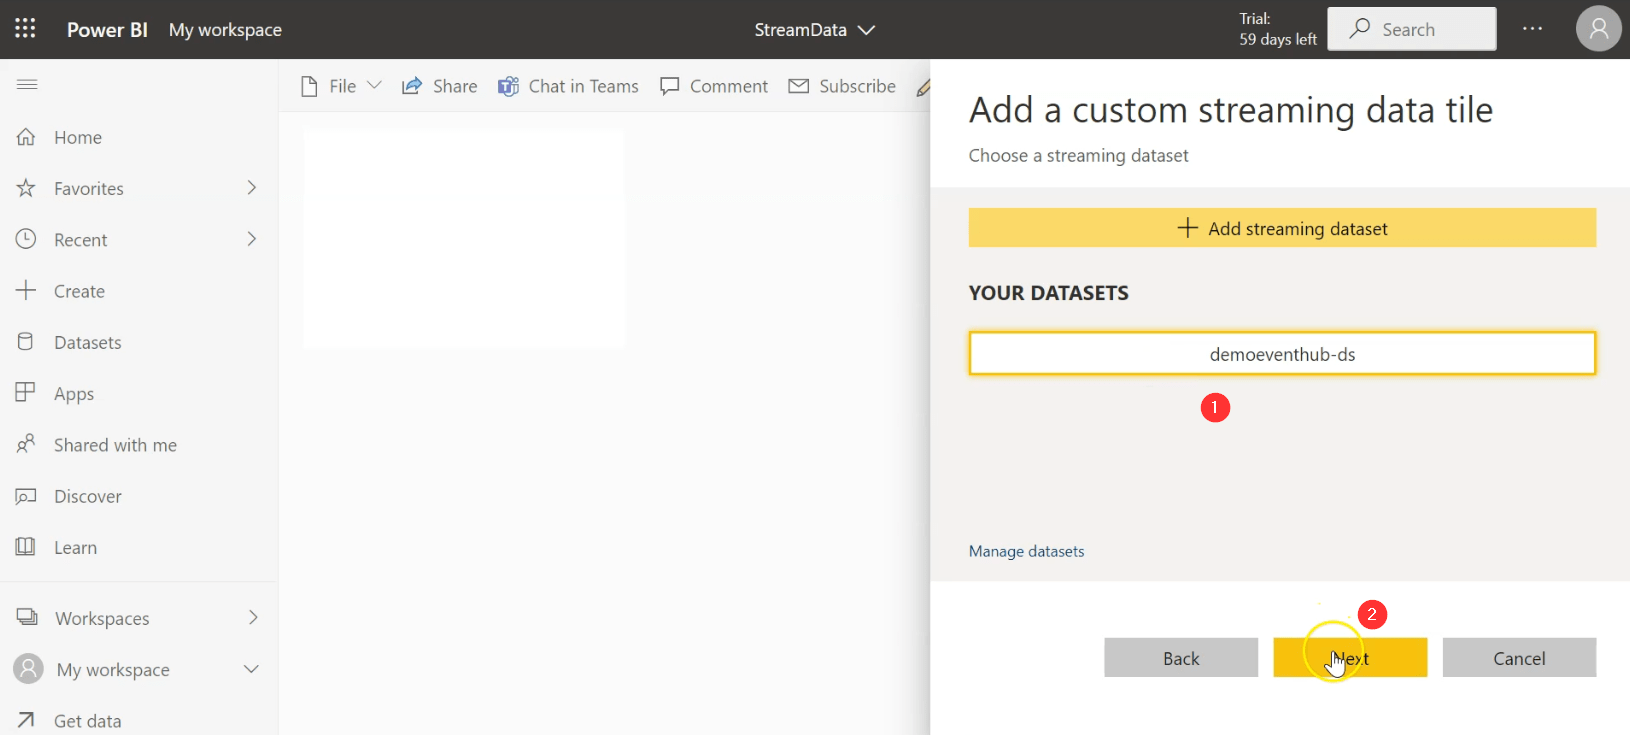
23. Add a new tile of type custom stream tile. Select Next.
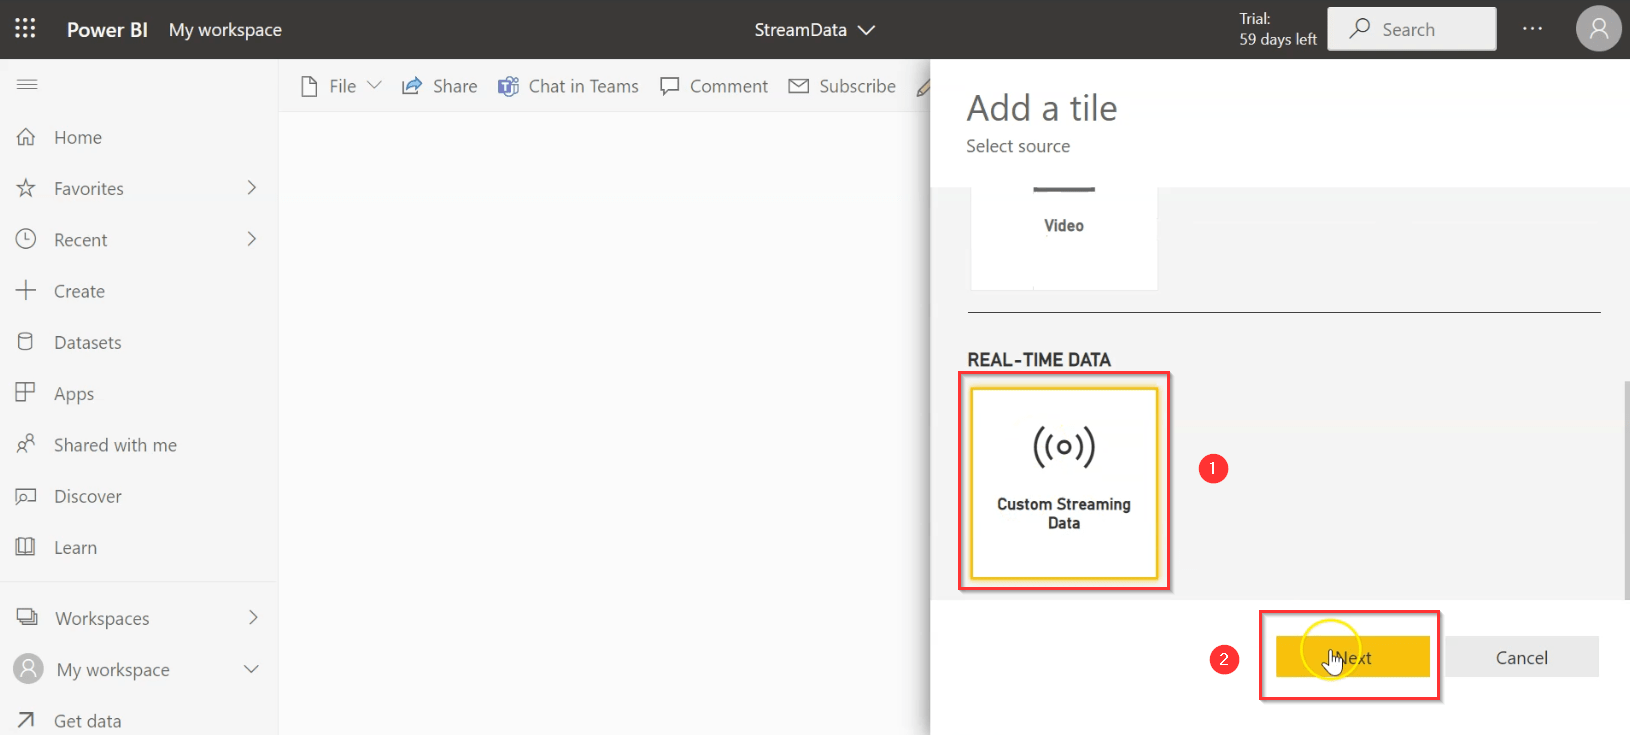
25. Select your dataset then click on next.
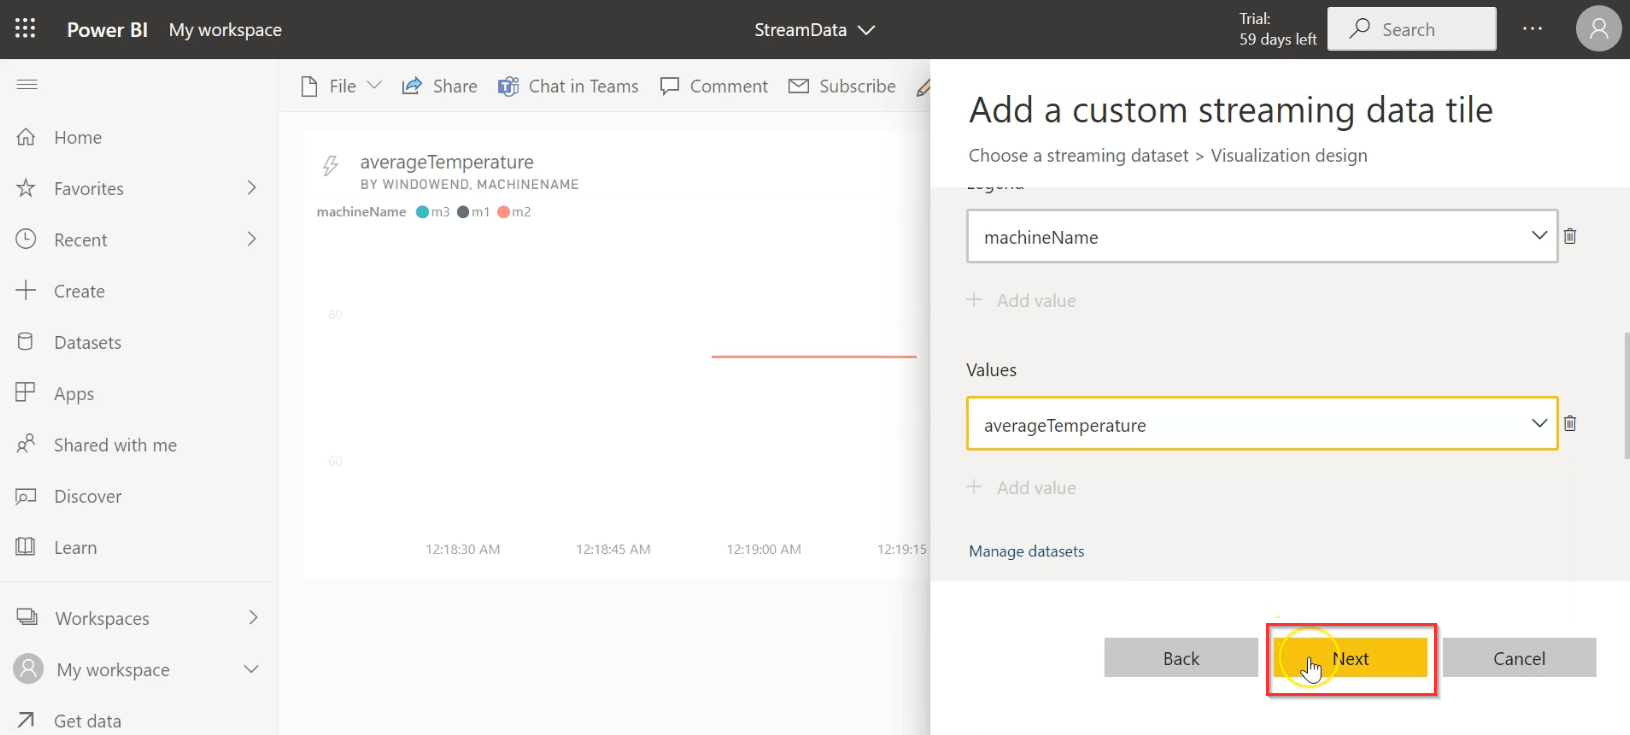
26. Create a live report by selecting the line chart and values for axis, legend, values, and tumbling window of 10 sec and click on NEXT.
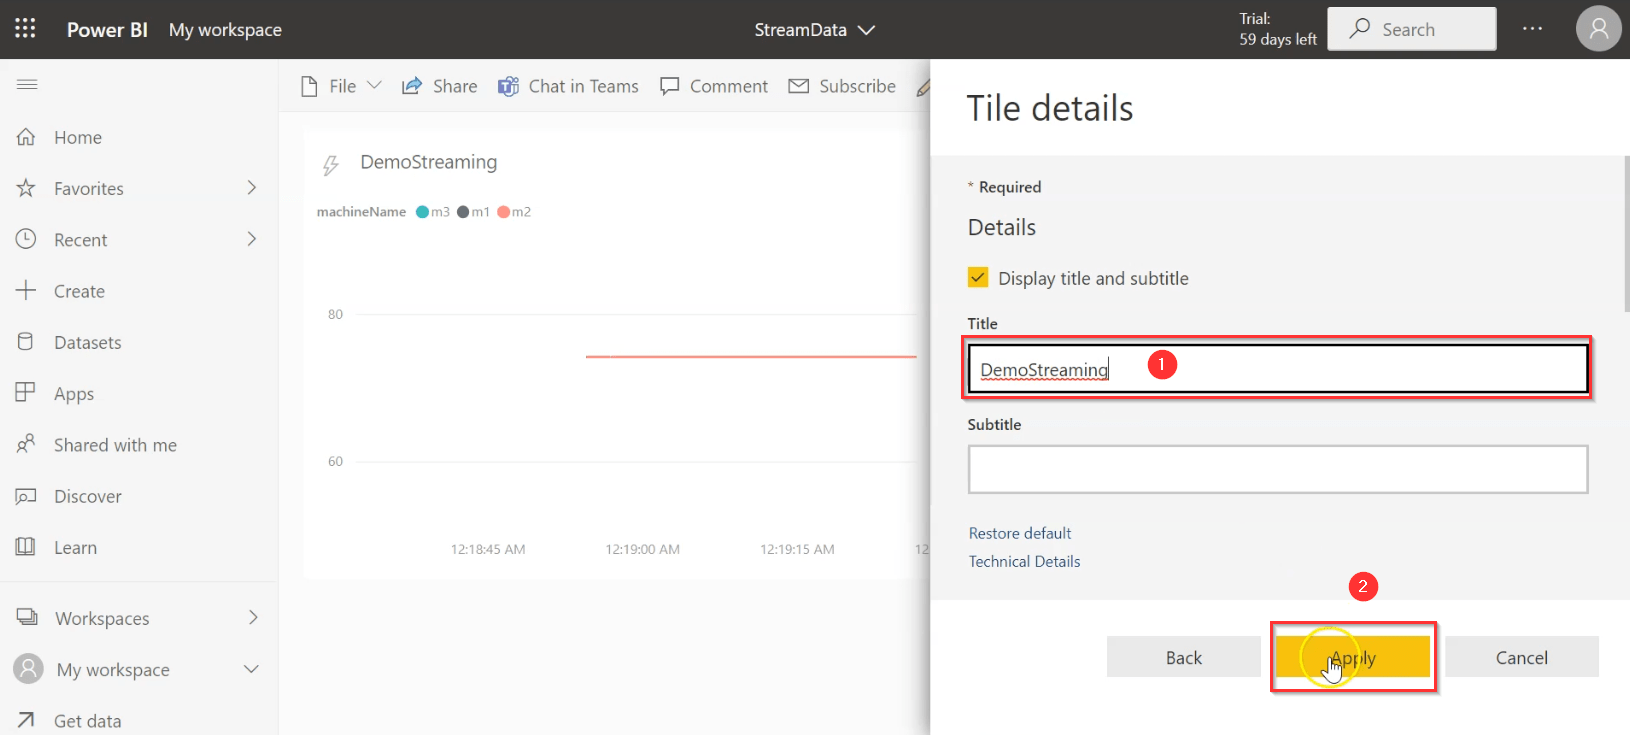
27. Give the name to the report as “DemoStreaming”. Select Apply.
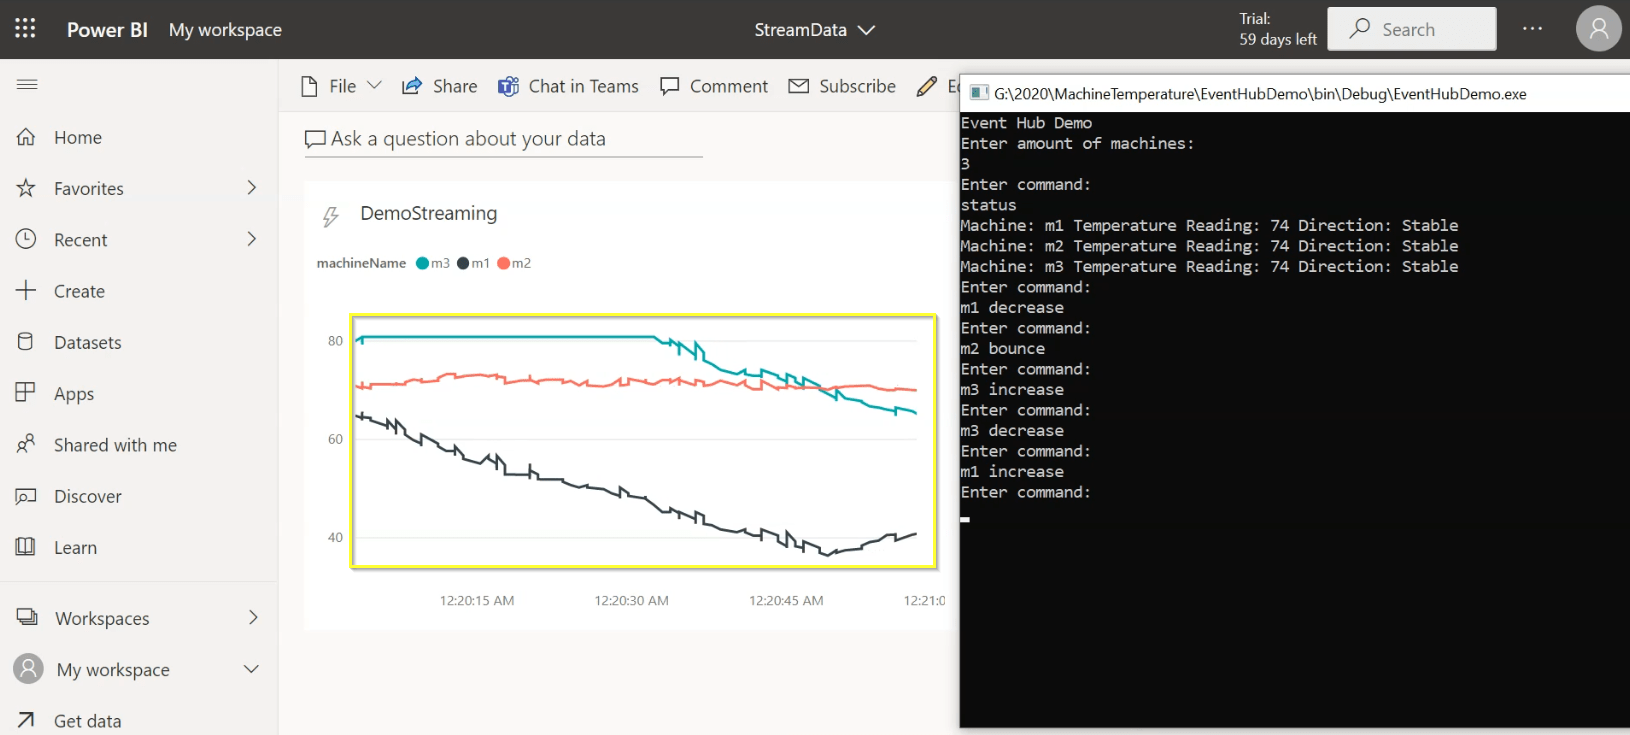
28. Now you can change values for temperature via an application and see the live changes occur on power BI reports.
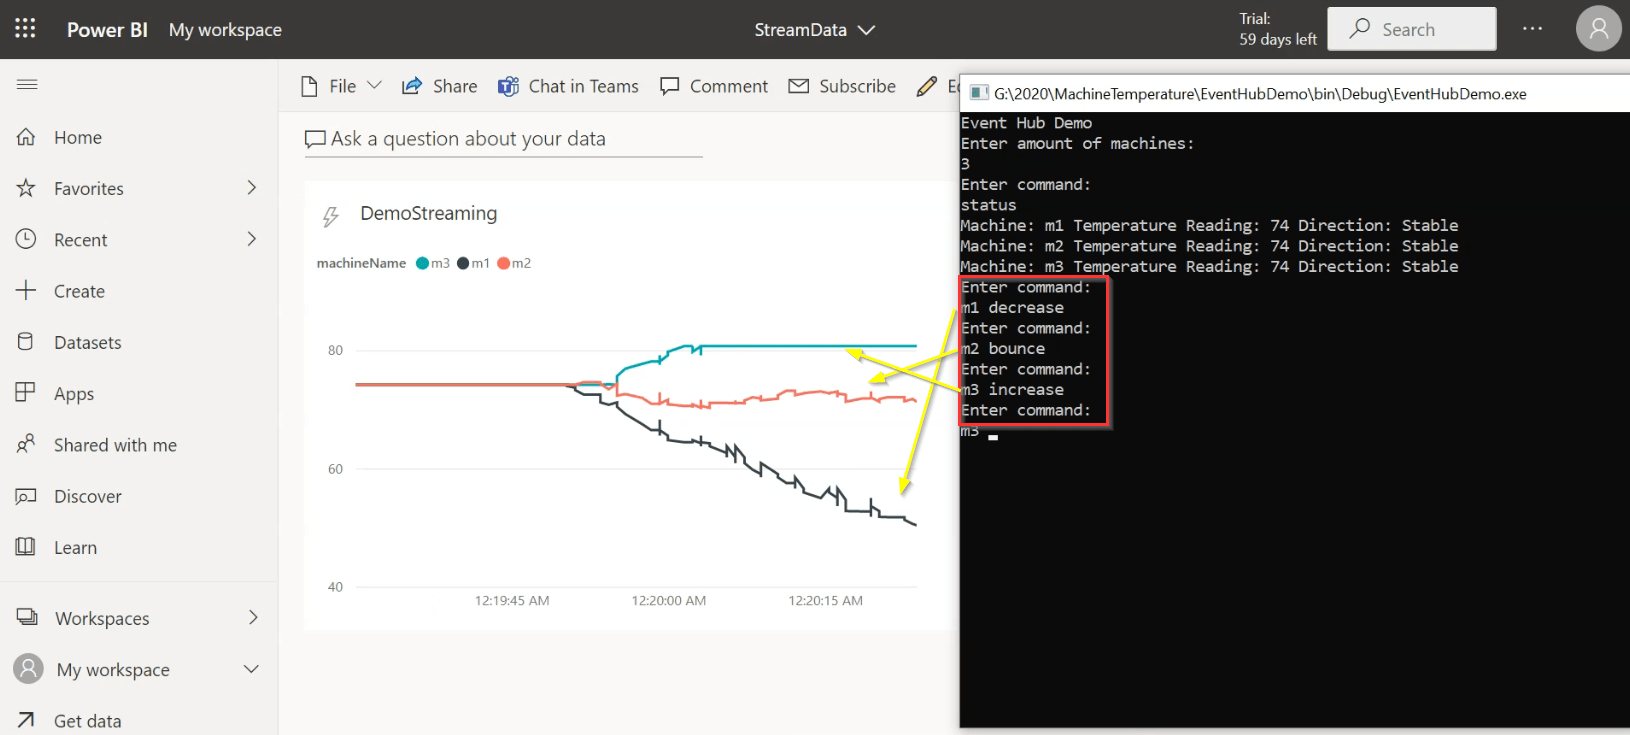
29. Congratulations! You have successfully Displaying Live Streaming Data Using Power BI Service.
References
- Introduction to Microsoft Power BI Platform | Everything You Must Know
- Exam PL-300: Microsoft Power BI Data Analyst | A Replacement Of DA-100
- Microsoft Certified Data Analyst Associate [PL-300] Step By Step Activity Guides (Hands-On Labs)
Next Steps to begin with PL-300 Certification:
In our PL-300 Certification Training Program, we’ll cover 10+ Hands-On Labs. If you wish to start your journey towards becoming a Microsoft Certified: Power BI Data Analyst Associate, try our FREE CLASS.

Does any document based on stream analytics input as (blob storage) and output as (power Bi) i have an doubt in creating output we need to create a Azure Resource Manager and how to setup an Input
Hi Soundarya,
Yes, Microsoft provides documentation on how to use Stream Analytics to process data from Blob storage and output to Power BI. Here are the steps for setting up input and output in Stream Analytics:
Create a Blob storage account and upload your data. You can follow the documentation here to create a Blob storage account and upload your data:
https://docs.microsoft.com/en-us/azure/storage/blobs/storage-quickstart-blobs-portal
In the Azure portal, navigate to the Stream Analytics job that you want to use for processing the data.
Click on “Inputs” in the left-hand menu, then click on “Add” to create a new input.
Select “Blob storage” as the input type.
Configure the input by providing a name for the input, selecting the Blob storage account that contains your data, and specifying the path to the data within the container.
Click on “Save” to create the input.
Next, click on “Outputs” in the left-hand menu, then click on “Add” to create a new output.
Select “Power BI” as the output type.
Configure the output by providing a name for the output, signing in to your Power BI account, and specifying the workspace, dataset, and table that you want to use for outputting data.
Click on “Save” to create the output.
Finally, go to the “Query” tab and write a query that selects the data from the input and outputs it to the Power BI output. For example, the following query selects data from the input and outputs it to a Power BI table called “MyTable”:
SELECT *
INTO MyTable
FROM MyInput
Click on “Save” and then “Start” to start processing the data.
That’s it! Your Stream Analytics job is now set up to process data from Blob storage and output to Power BI. Note that you may need to grant Stream Analytics access to your Blob storage account and Power BI workspace and dataset in order for the input and output to work properly. The Azure documentation provides detailed information on how to configure these permissions.
Hope this helps.
Thanks and Regards
Rahul Dangayach
Team K21Academy