![]()
This blog post gives a step by step process of integrating Datadog in your Azure DevOps Environment and also covers the following topics:
- How To Install And Work On Datadog Agent
- Create A Service Hook For Azure DevOps Services And TFS With Datadog
- Datadog Monitors as Deployment Gates
This blog talks about technologies that are part of the Azure DevOps environment. If it’s something in which you have an interest or you want to learn it then you can visit our previous blog to know more about the [AZ-400] Microsoft Azure DevOps certification.
Datadog is an essential monitoring platform for cloud infrastructure, applications, and logs. They bring together data from servers, containers, databases, and third-party services to make your stack entirely observable. By adding this extension, we’ll be able to utilize any monitors in Datadog to stop problematic deployments in their tracks by adding Datadog Monitors as gates in your Azure Pipelines.
How To Install And Work On Datadog Agent
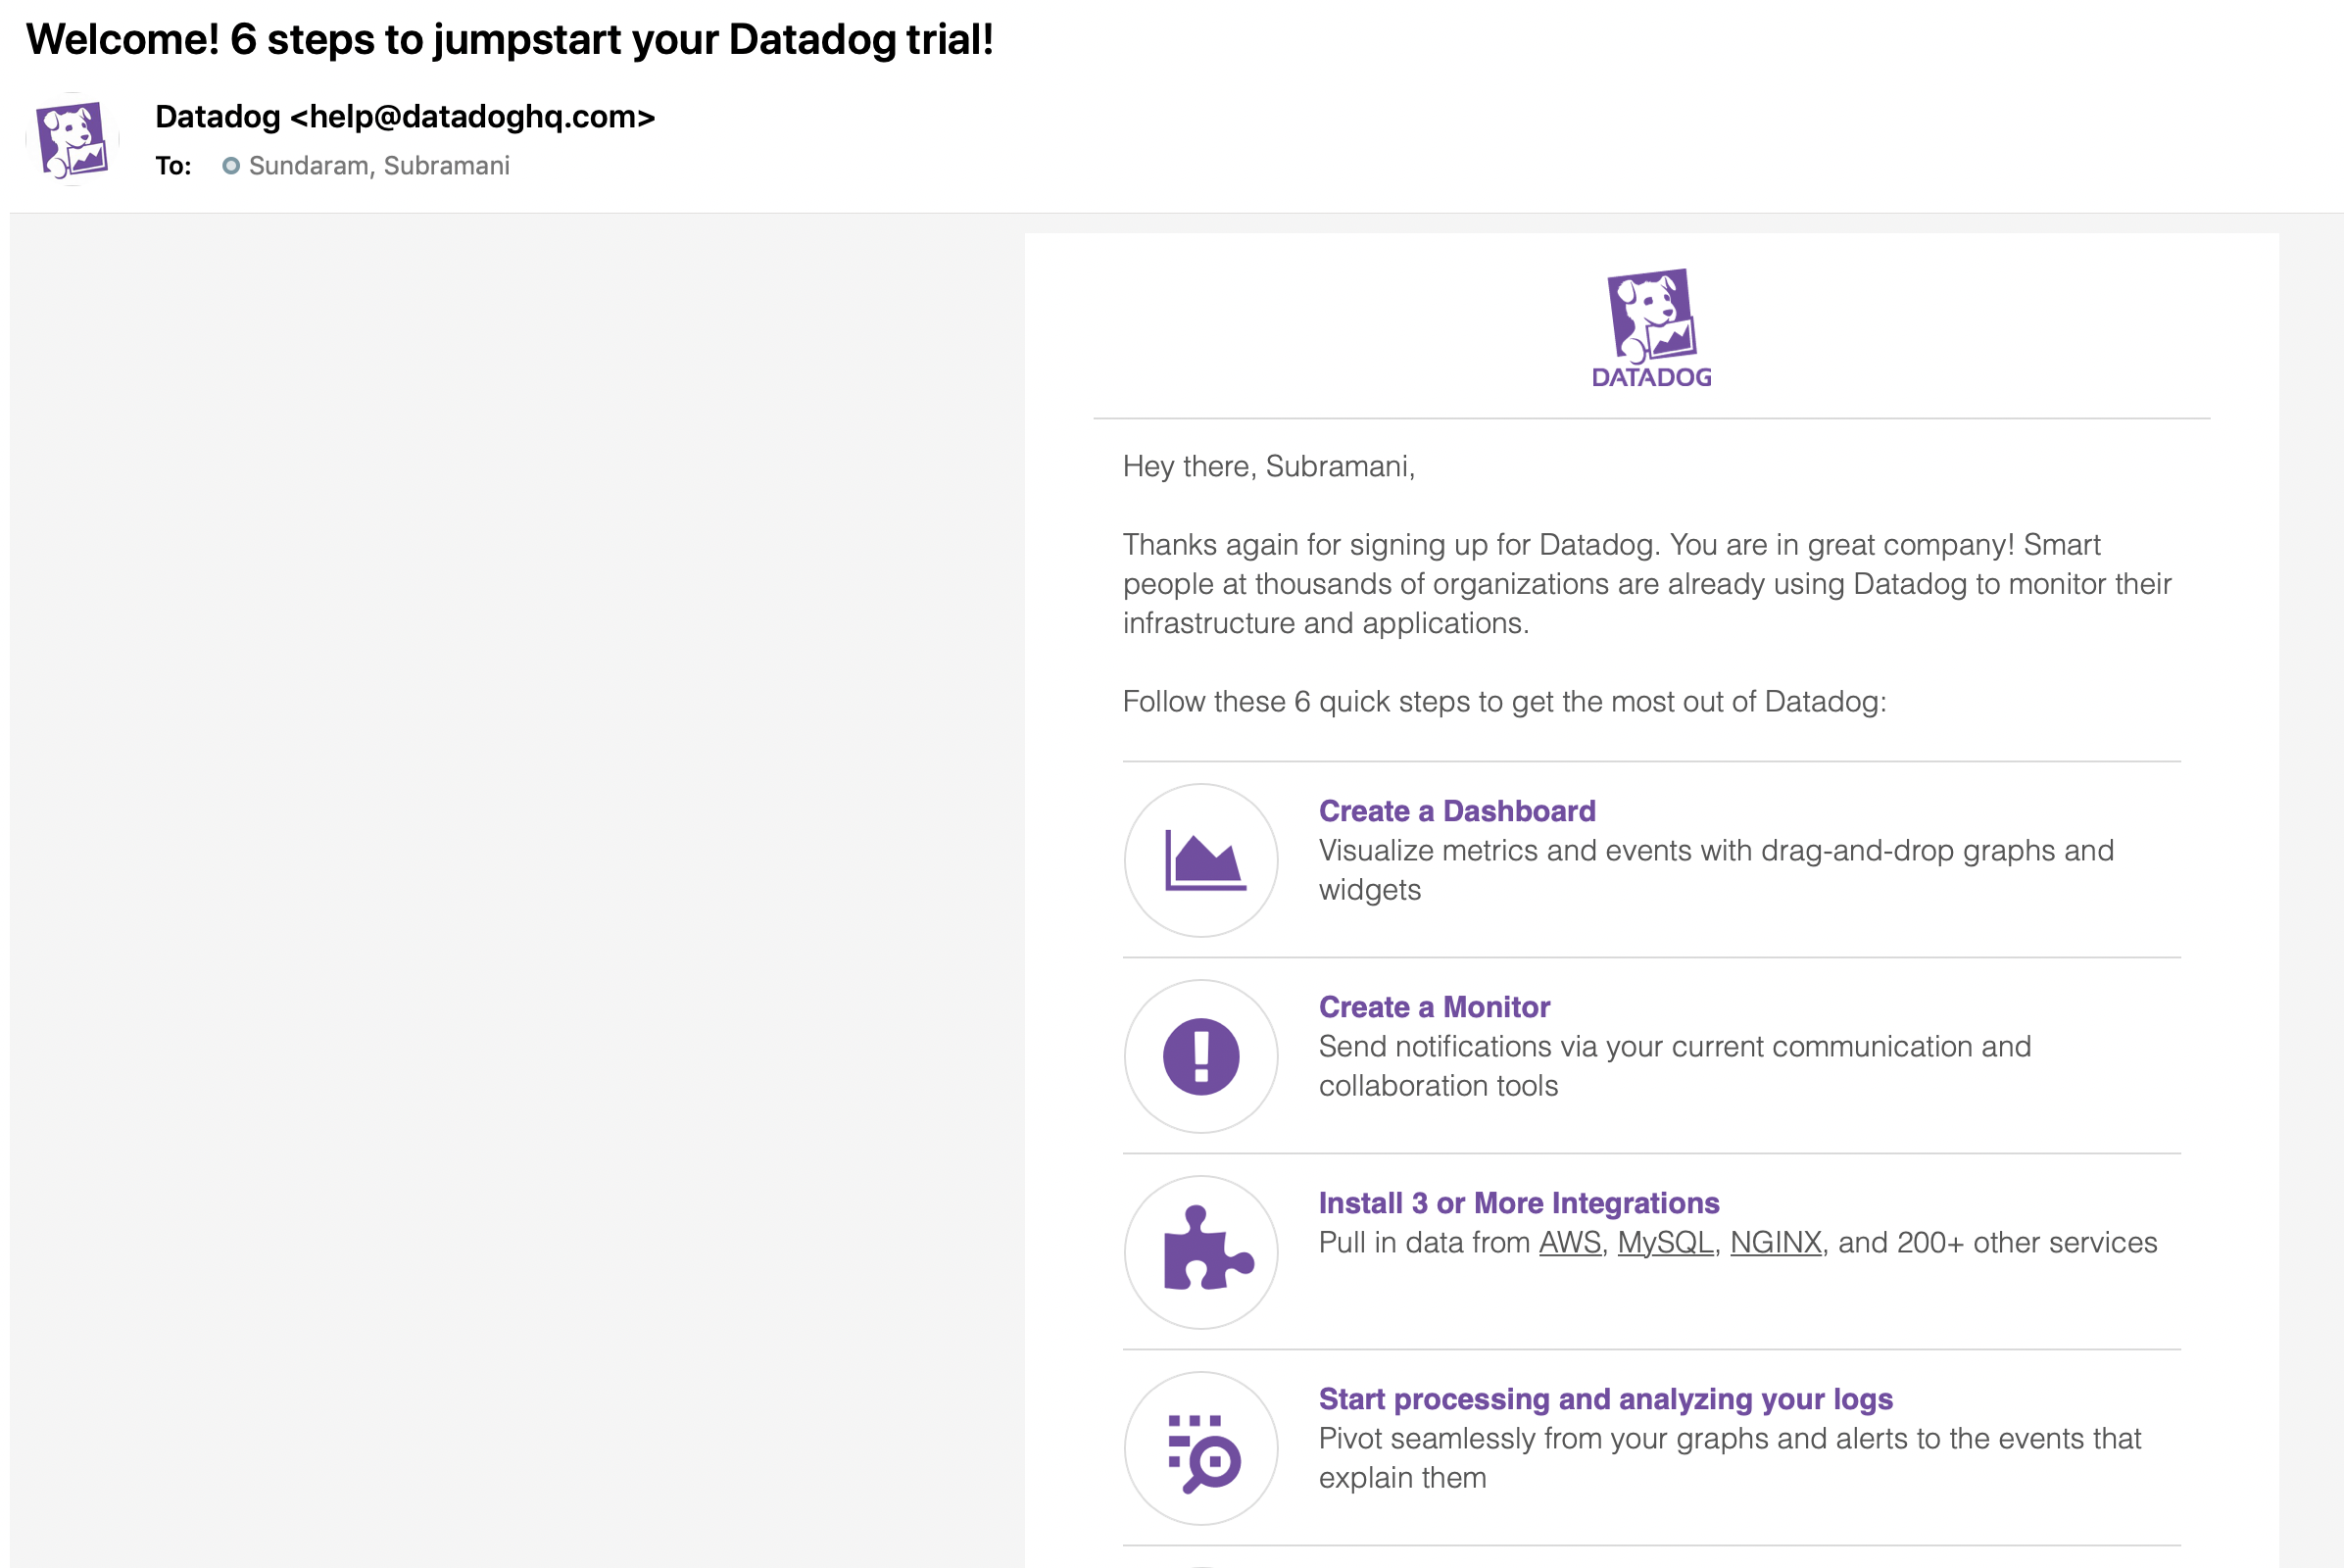
Step 1: We need to first register ourself on the Datadog with the details such as email id and name and other details.
Step 2: Then we need to install the agent on our local machine whether we are using Windows or Mac or Linux.
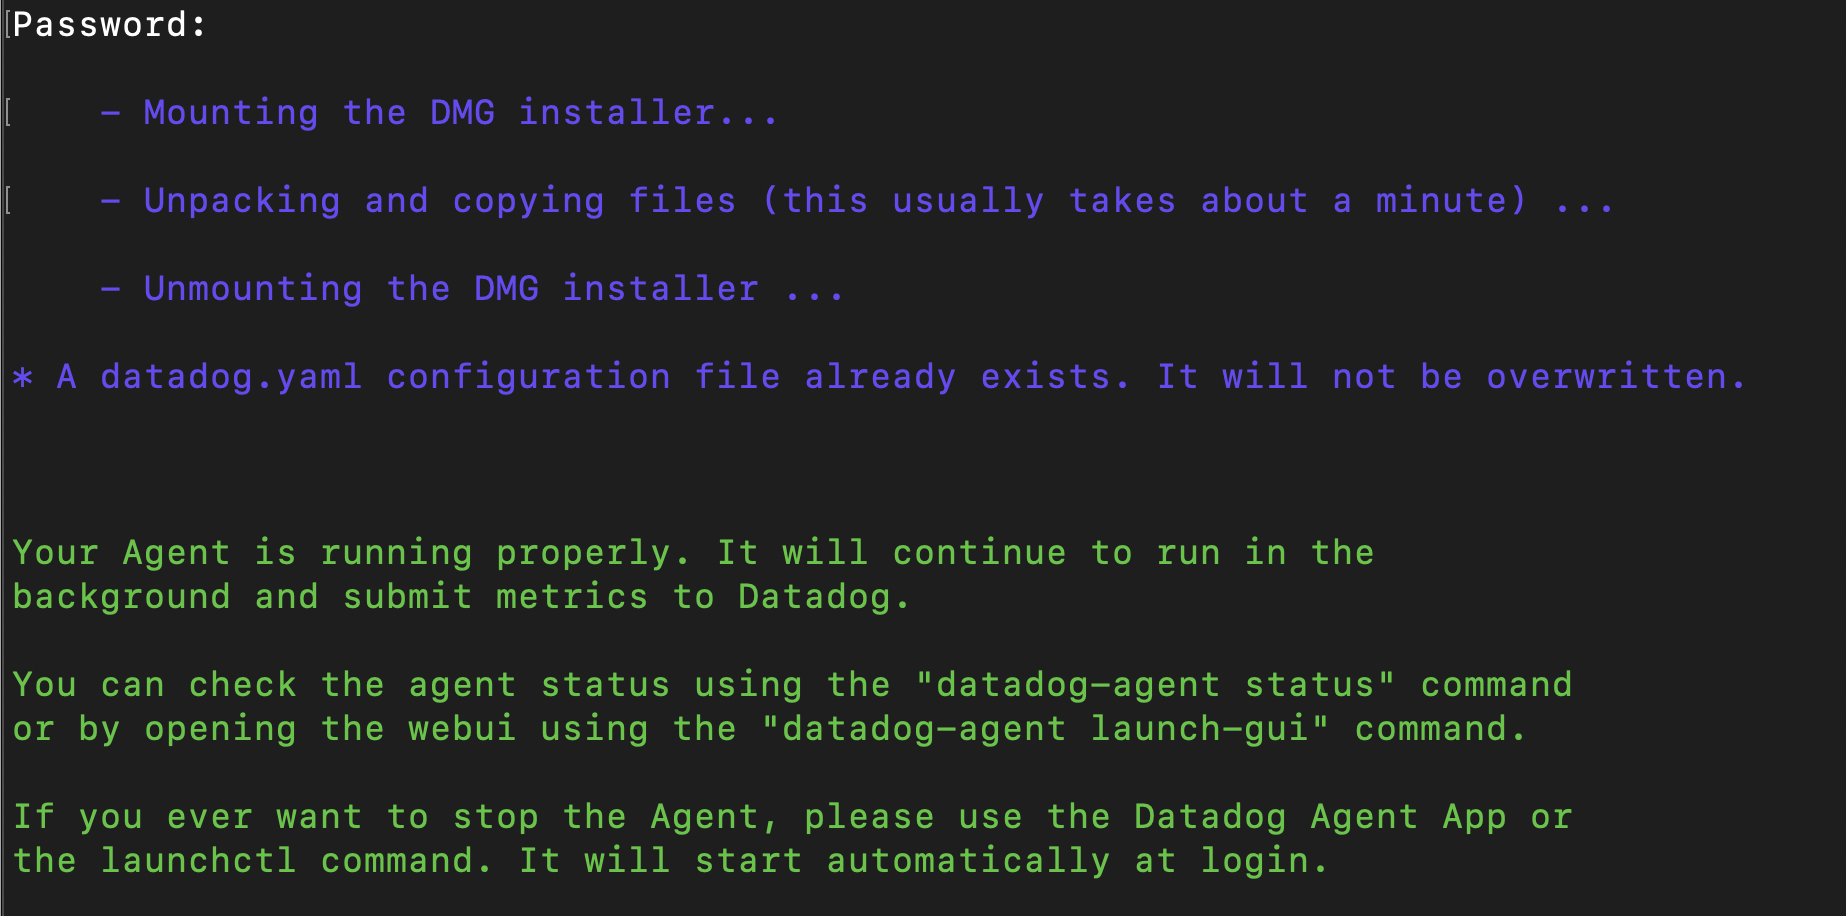
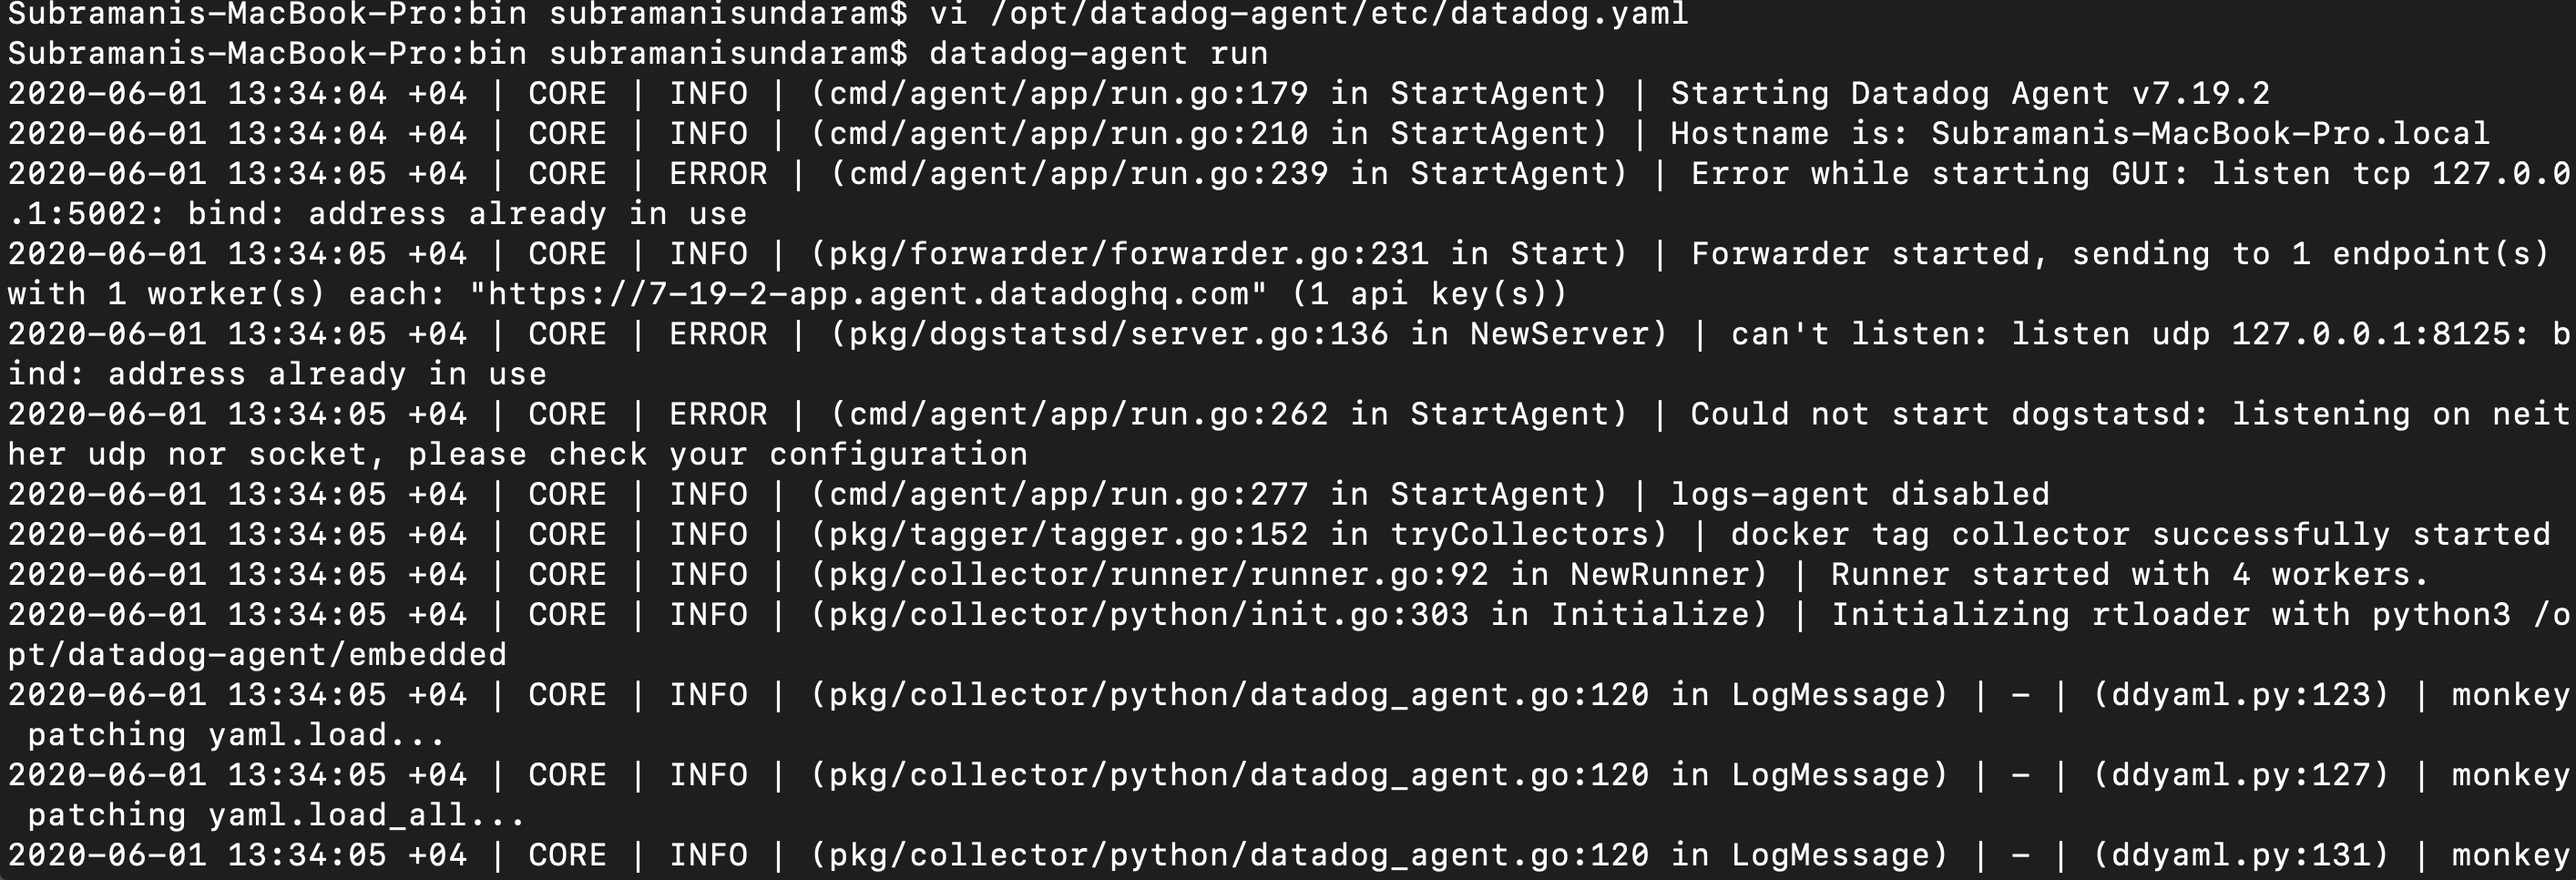
Step 3: Download the agent and then run the script given below :

Note : You Can Check Our Blog on Azure DevOps.
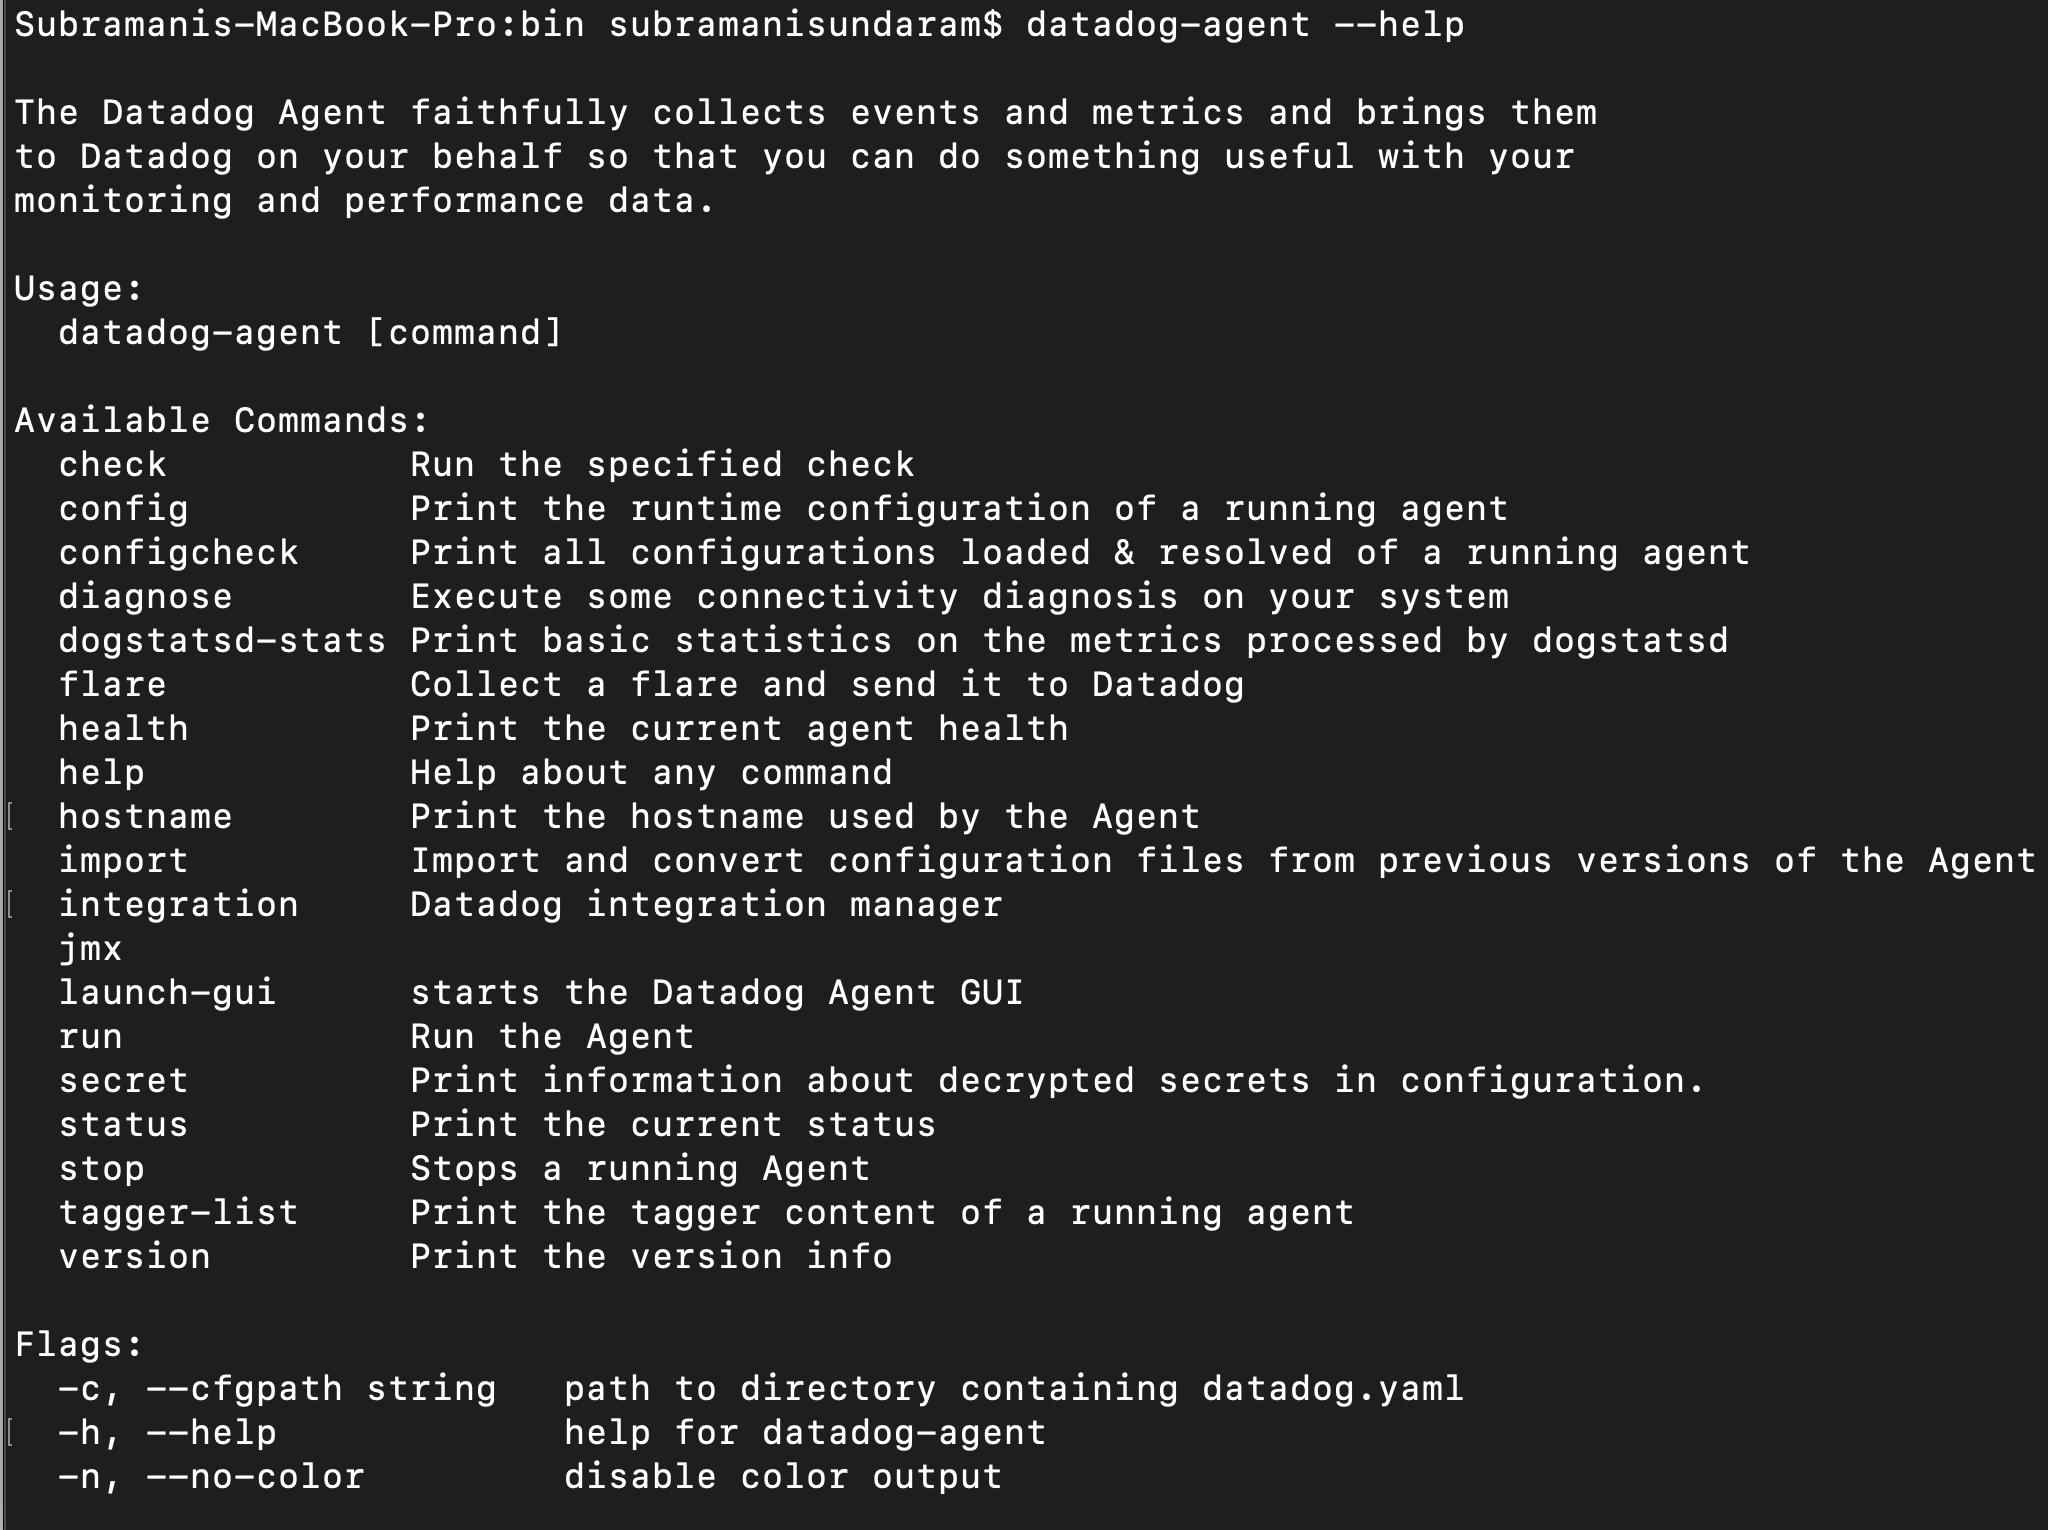
Step 4: Then we need to start the Datadog agent by running the command and then we can see the agent is running and then we can start configuring the Integrations.
Step 5: Then log in to this site (https://app.datadoghq.com/) with the username and password that we will receive over the email.
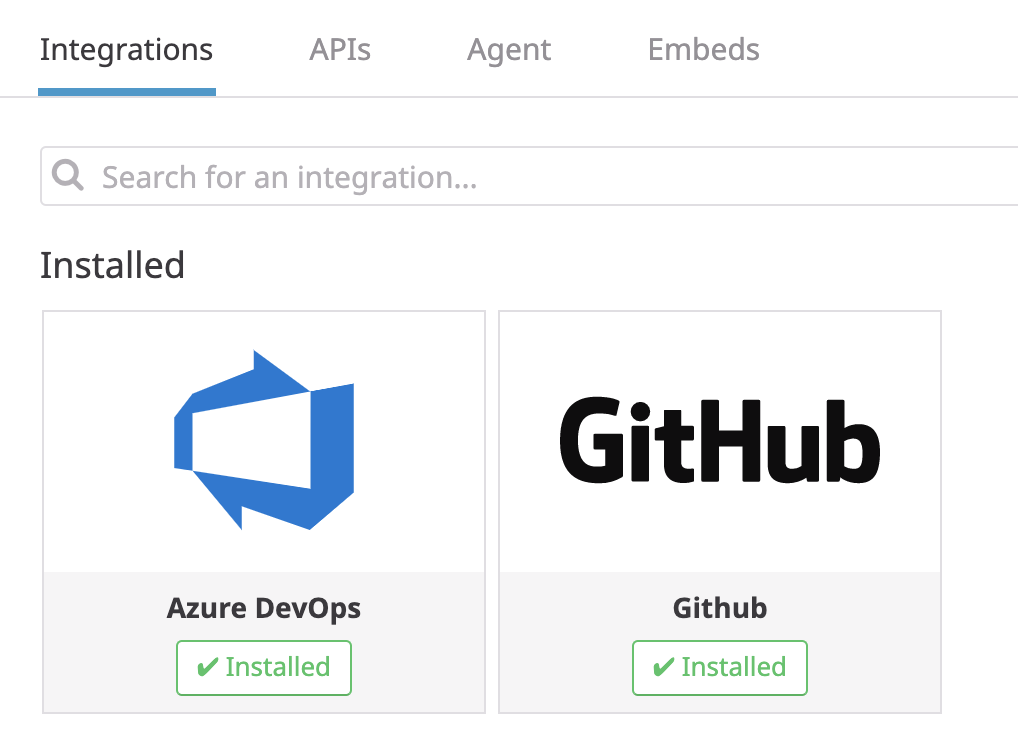
Step 6: Click on the Integrations section and choose which one we wanted to get integrated with. In my case, I have chosen the GITHUB and AZURE DevOps.
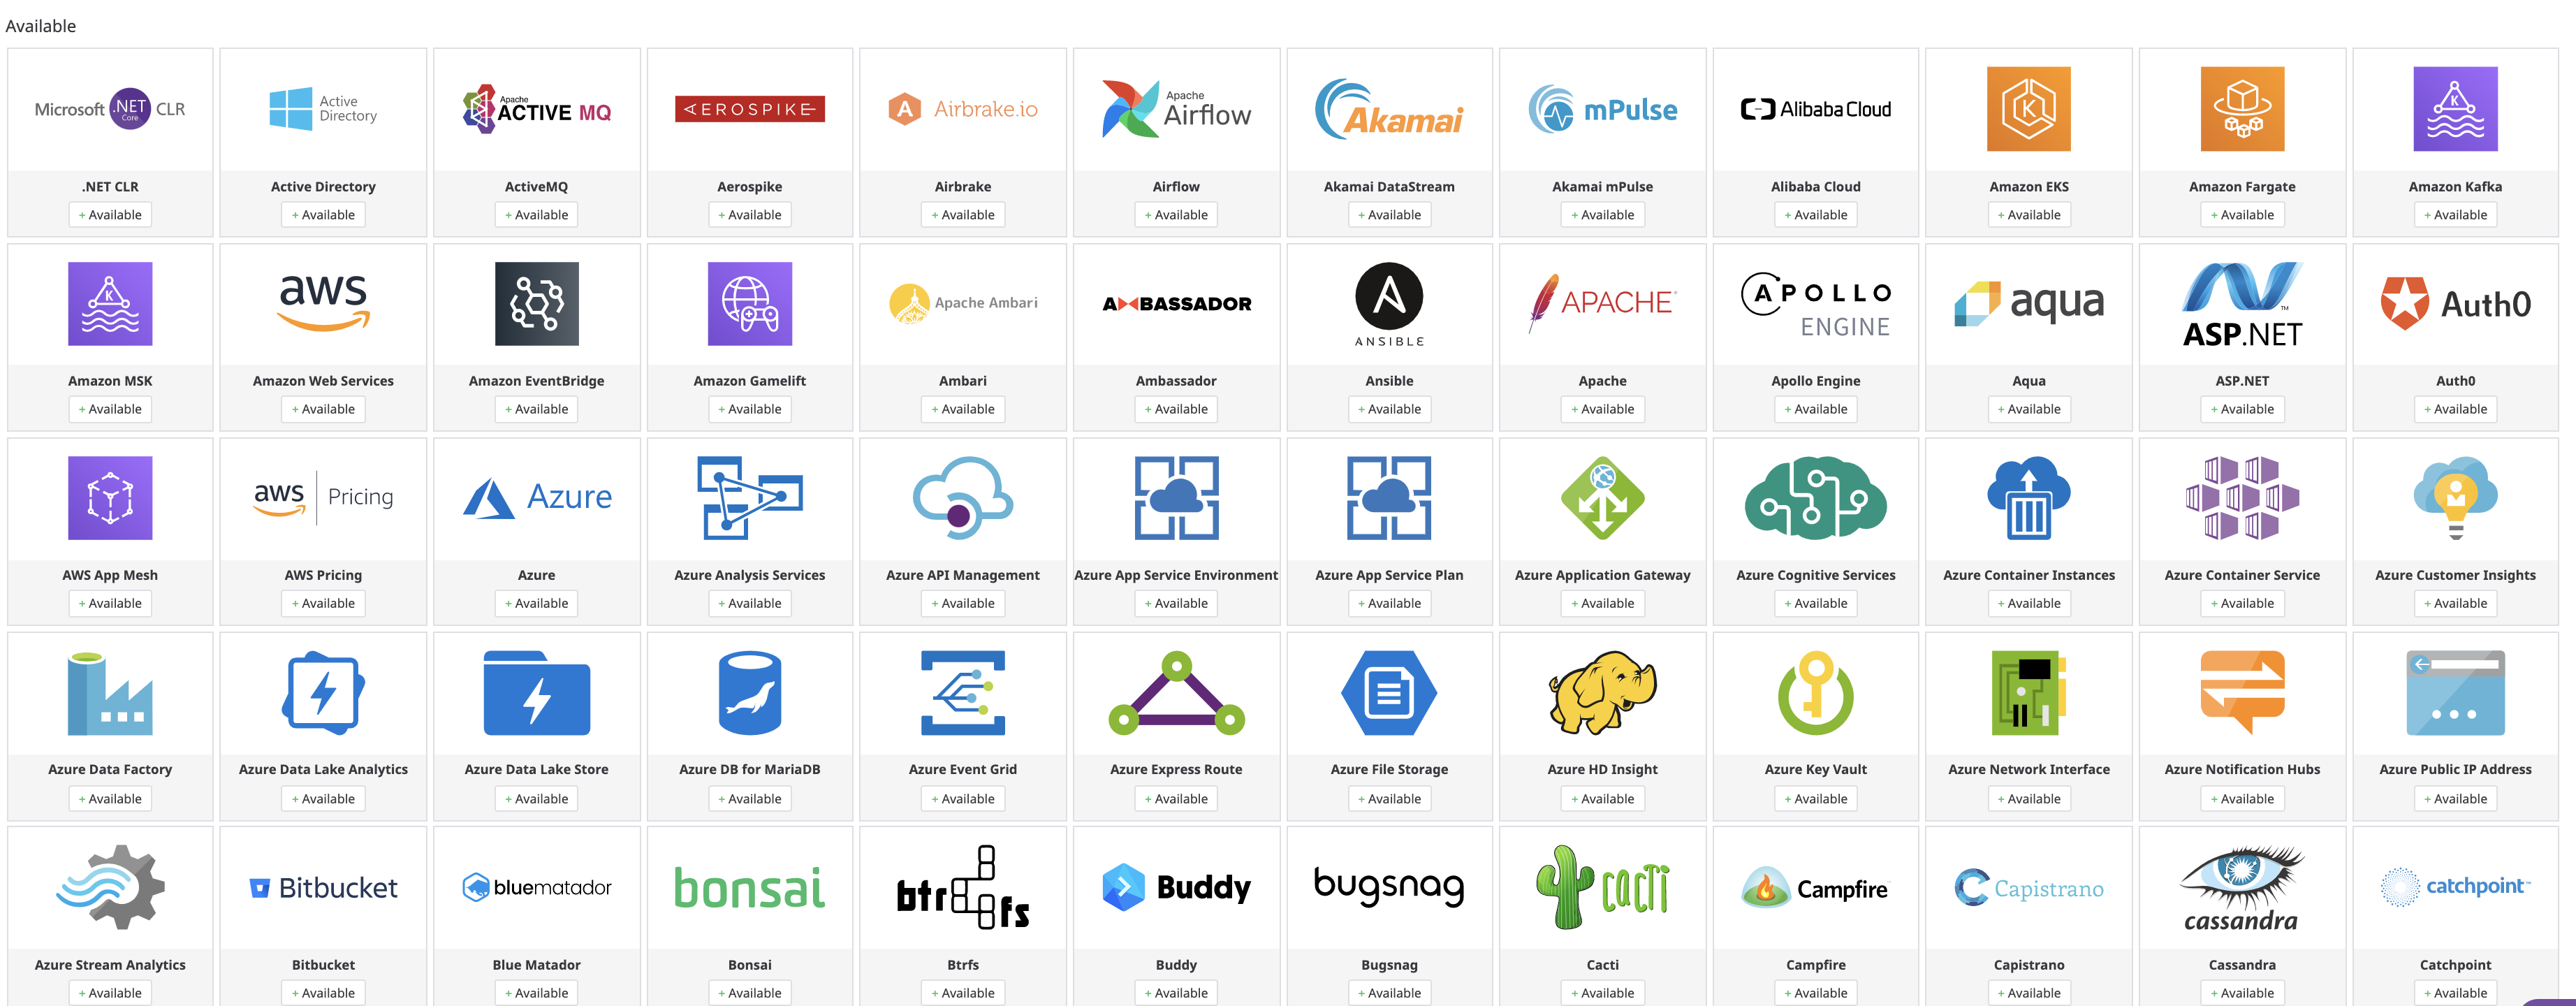
Step 7: There are more than 100+ options available for Azure, AWS, Docker, Ansible, etc. We can choose which one we want and based on that we need to do our configurations.
Note : Do Check This Blog on Azure Policy Compliance .
Note : Do Check Our Blog on Veracode.
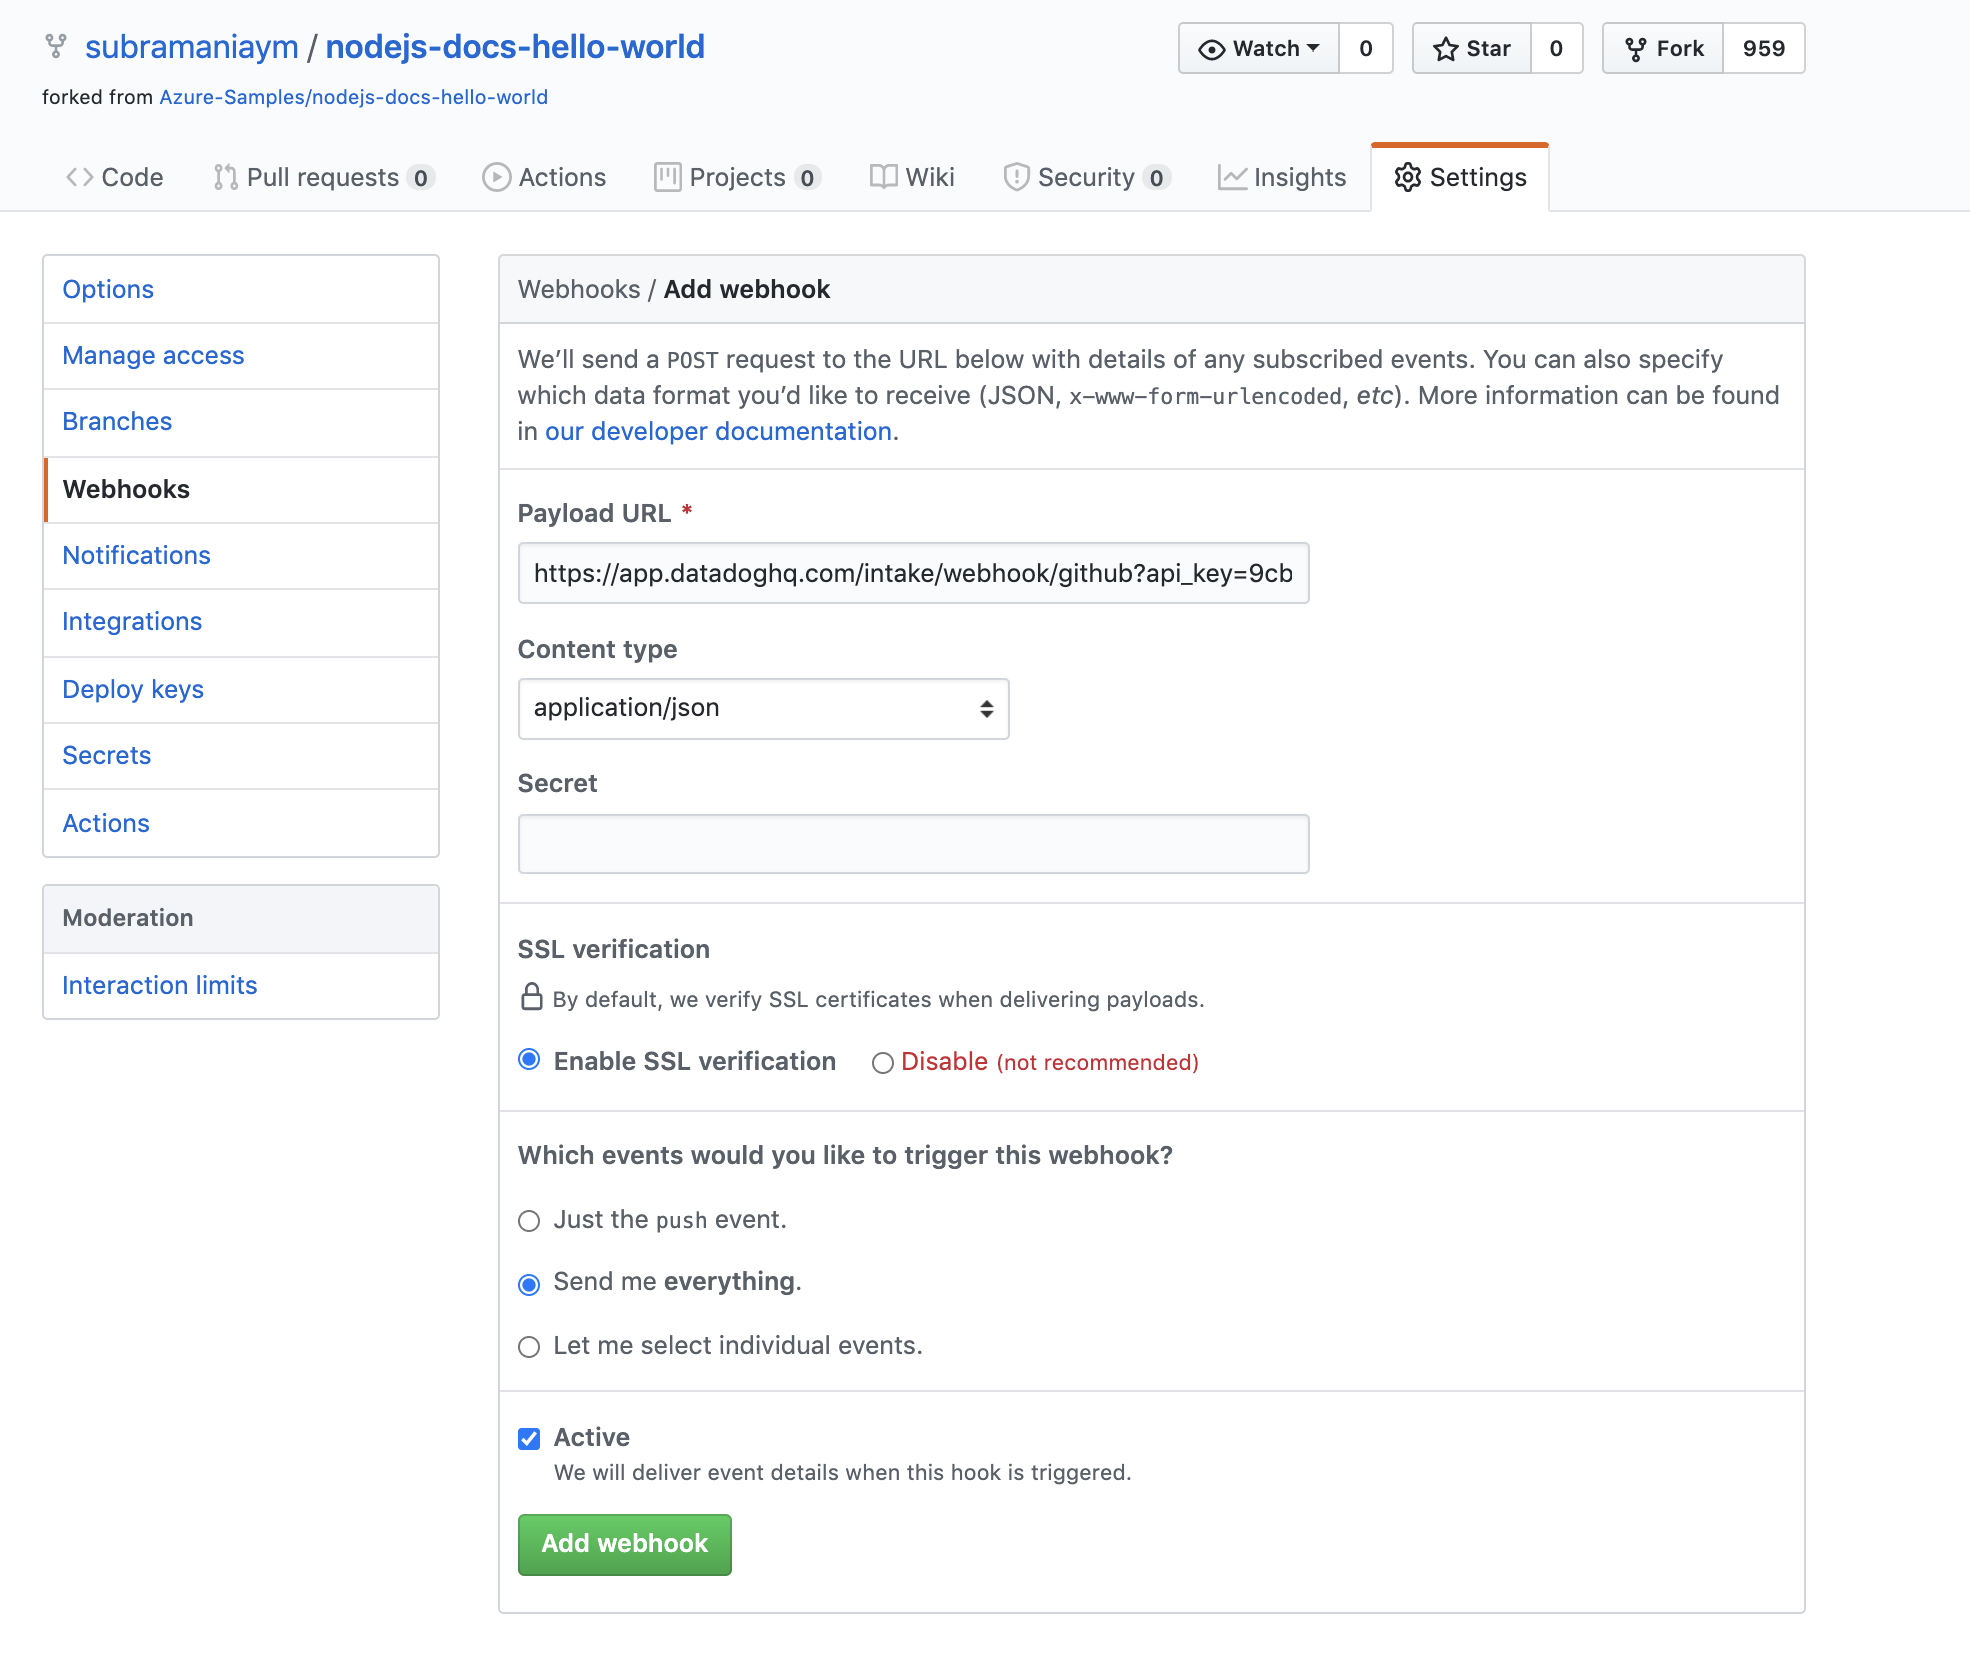
Step 8: After choosing the GITHUB, we need to click on the configuration tab and see what is the configuration that we need to do on the GITHUB side.
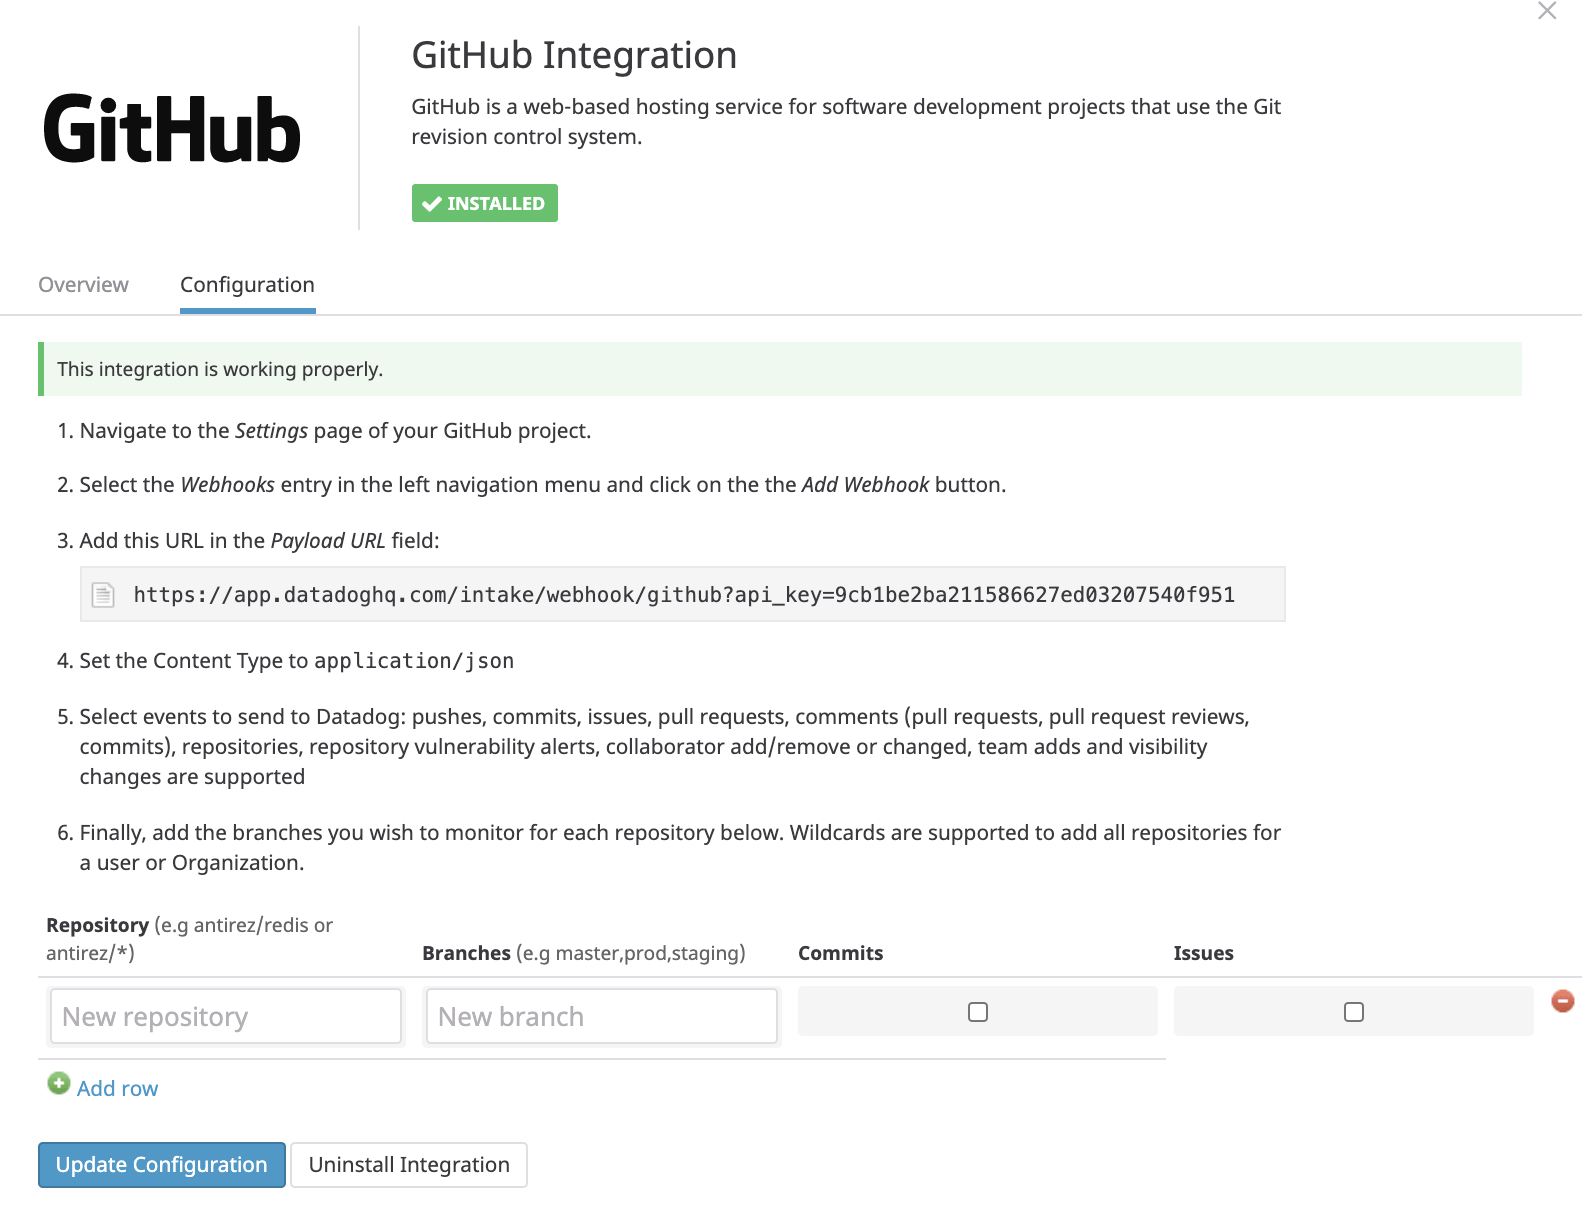
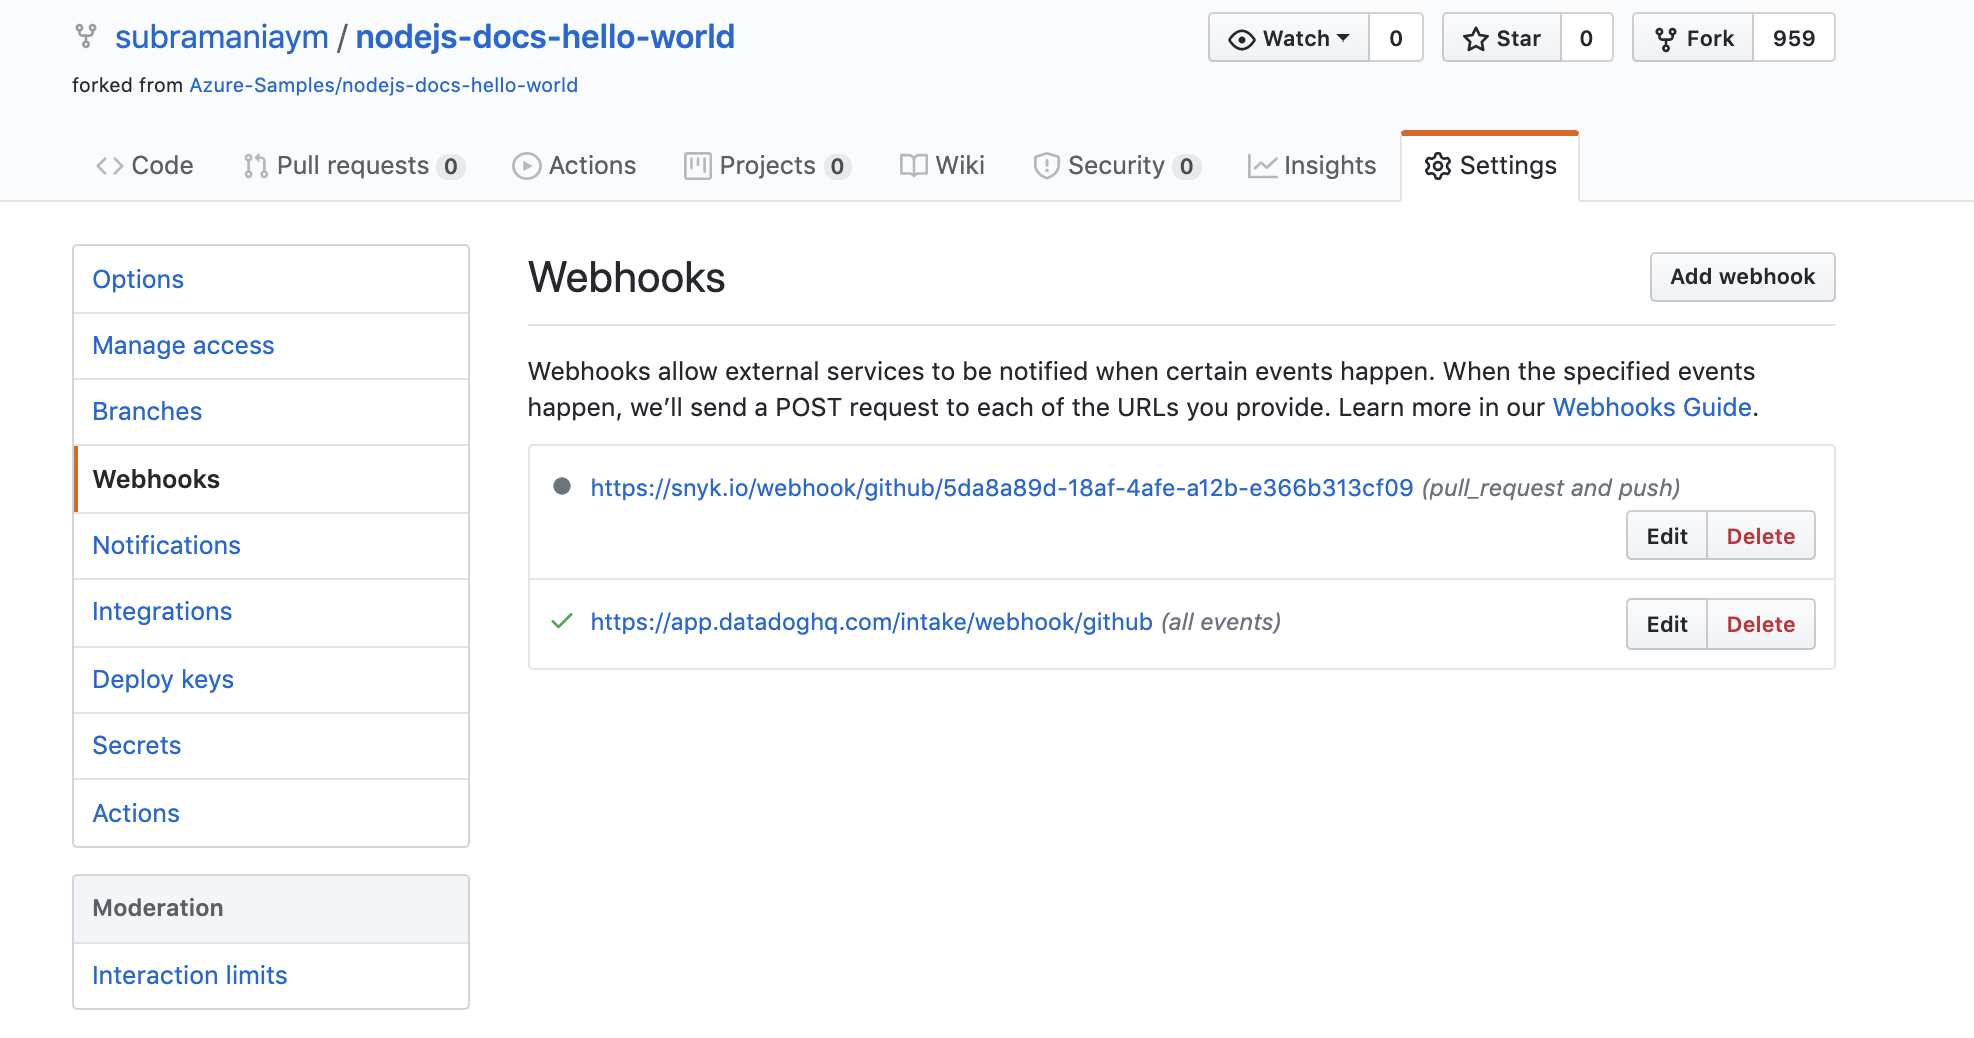
Step 9: After copying this Webhook from here, I need to go to Github and go to settings and then paste it there so that i can get all the changes done on the GITHUB to the Datadog and I can monitor it as events across.
Also Check: Our blog post on Azure Docker Compose. Click here
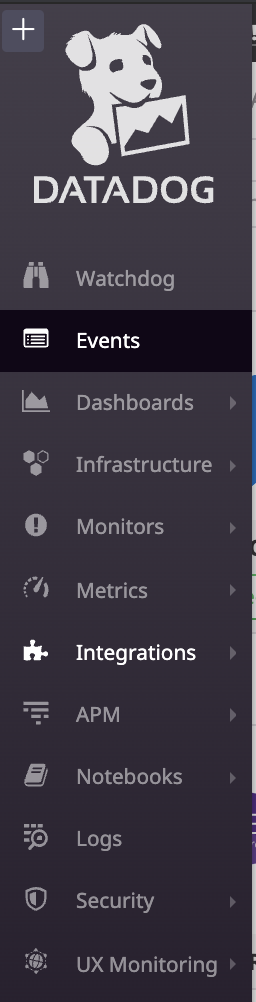
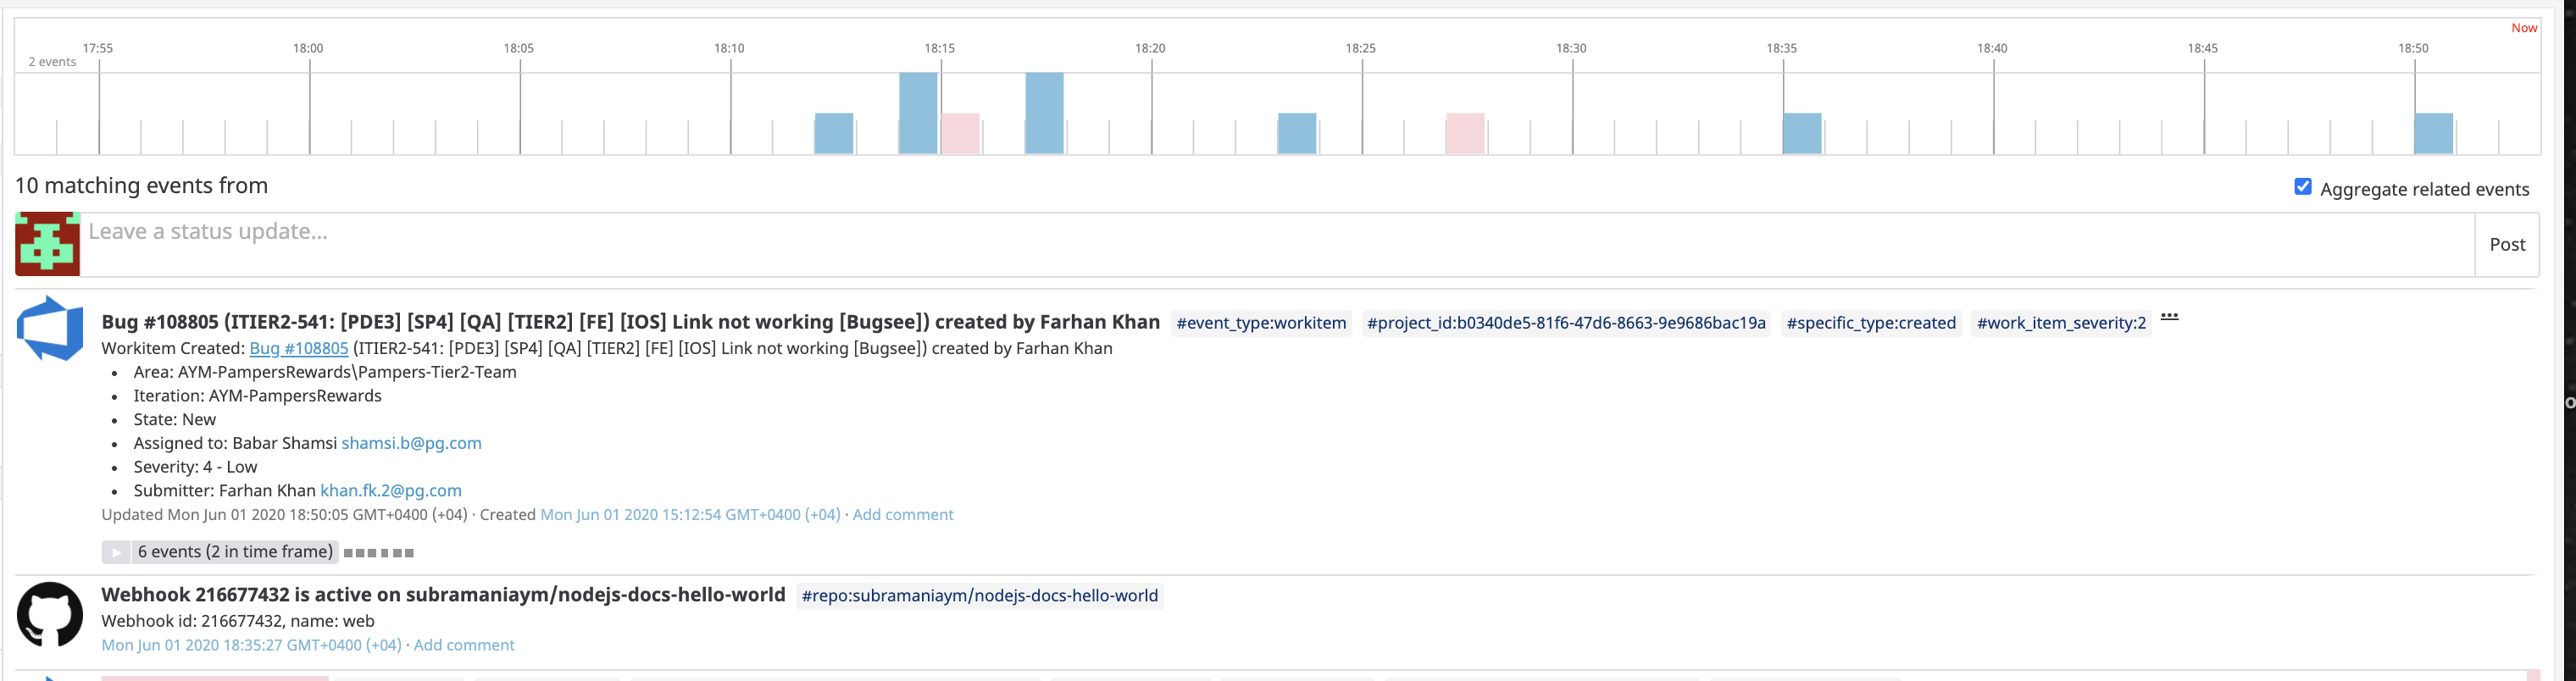
Step 10: Now after the above setup, we need to go to the below events and check the items that we are doing on GITHUB will be reflected here.
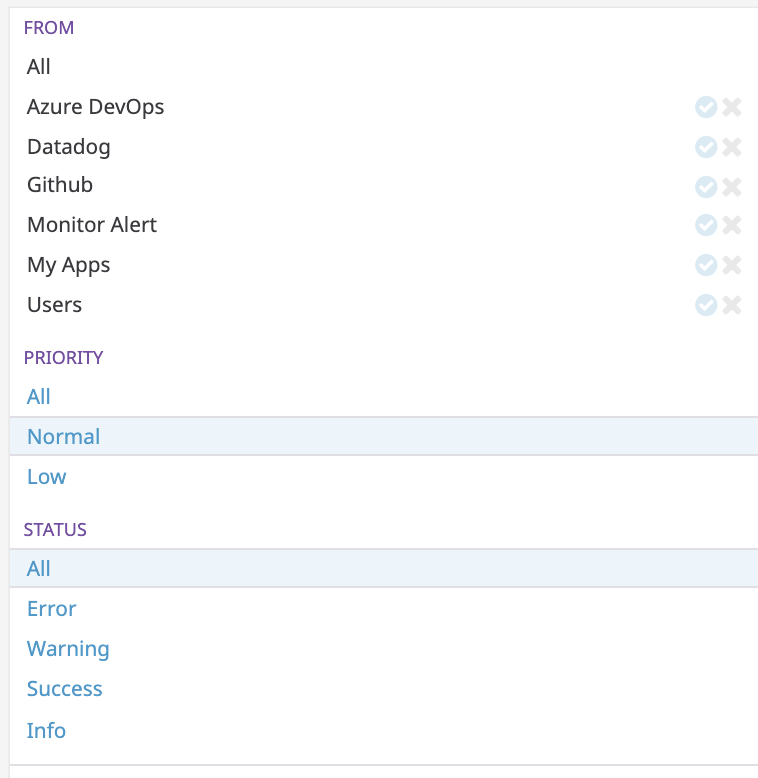
We can choose the Azure DevOps and GitHub events from the above checkbox and then we can start seeing the events on whatever is happening on both the tools.
Then we need to go to the Menu and Dashboards and then choose the Azure DevOps Dashboard accordingly.
Check Out: What is DevSecOps? Click here
Create A Service Hook For Azure DevOps Services And TFS With Datadog
Step 1: Before we do the above step and above integration, we need to follow this one like we need to set up the service endpoint.
Step 2: Create events and metrics in Datadog in response to events from Azure DevOps Services. Use these metrics and events in Datadog to create dashboards, troubleshoot issues, and create monitors to alert you of critical issues. Accepts all Azure DevOps event types.
Step 3: We need to get the Datadog API key and then put it on the service hook of Azure DevOps.


Step 4: Test the service hook subscription and finish the wizard.
Step 5: Repeat steps 2–5 for each event type you want to send to Datadog. Datadog accepts and encourages users to send all event types.
Step 6: Now that the service hooks are configured, go to Datadog to see events and metrics start to flow into your environment.
Also Read : Our Blog on Azure Pipelines vs Jenkins
Datadog Monitors as Deployment Gates
Consider a canary deployment that updates an e-commerce website in stages across different regions. To ensure the update was successful before rolling it out to the next region, you might want to check the status of various health indicators in the recently updated region, such as:
- the memory and CPU utilization of hosts in that region
- the number of error logs from your shopping cart application
- the results of an automated browser check, which verifies that the website’s regional endpoint loads quickly and responds correctly to simulated user actions
In Datadog, we can create individual monitors for everything you want to know about, and then combine them using a composite monitor, using simple logic statements to specify the desired combination of monitor conditions.
Then, we can set that composite monitor as a gate between the two stages of a pipeline to automatically stop deployment if an unhealthy state is detected in Datadog.
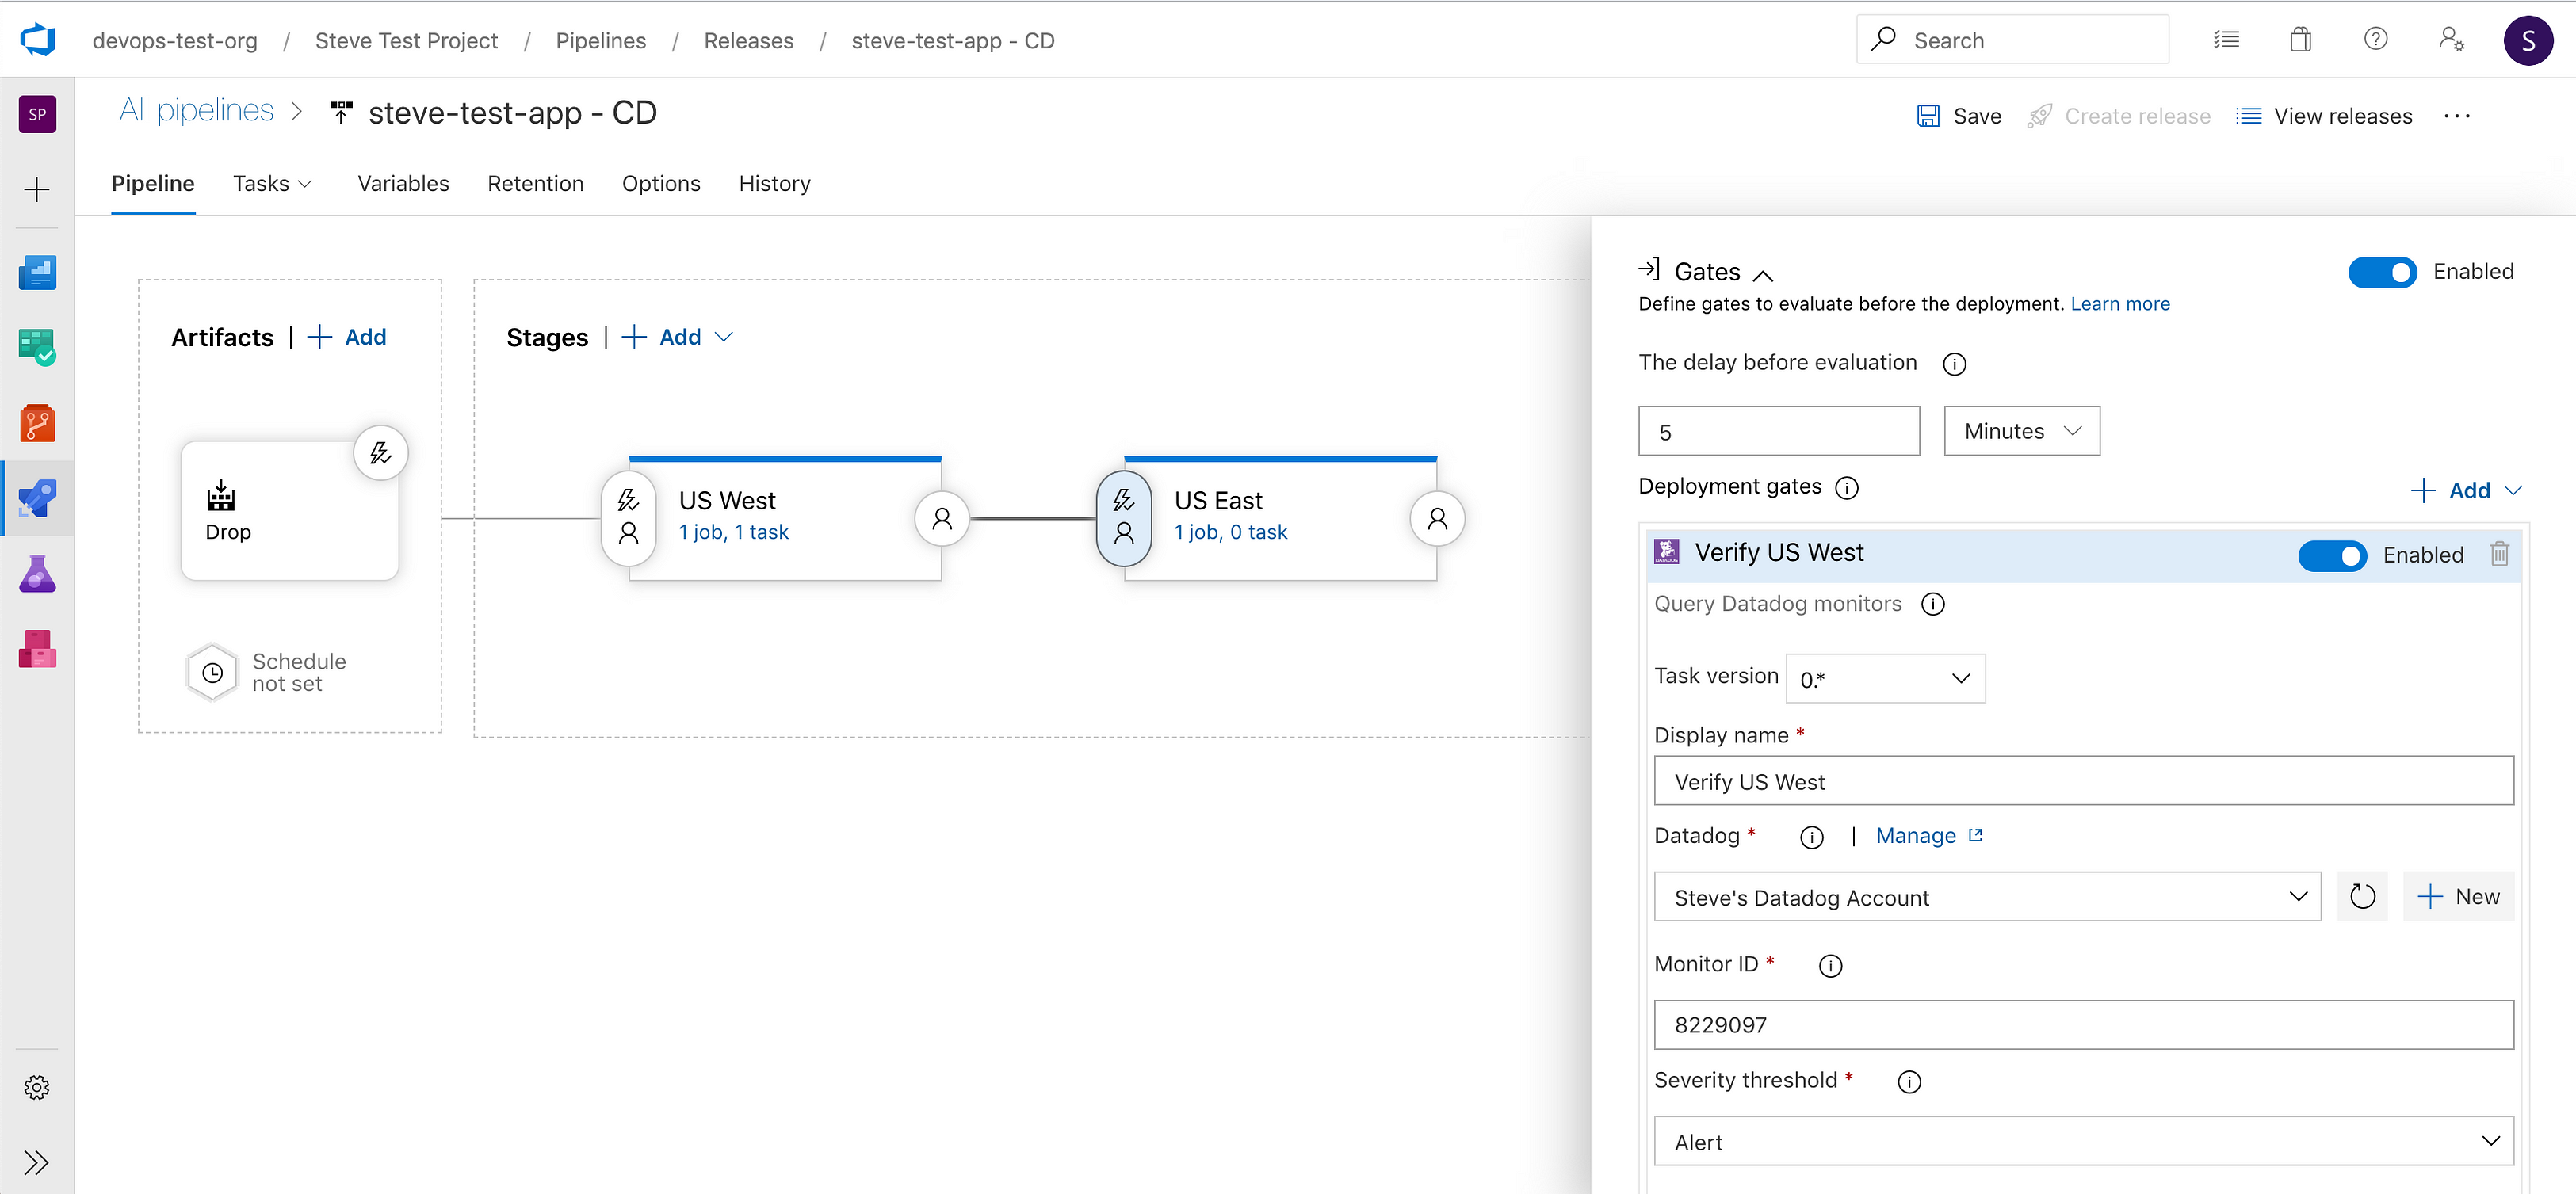
We can define the health of our service, using Datadog monitors as gates in Azure DevOps can help you ensure that your deployments go off without a hitch.
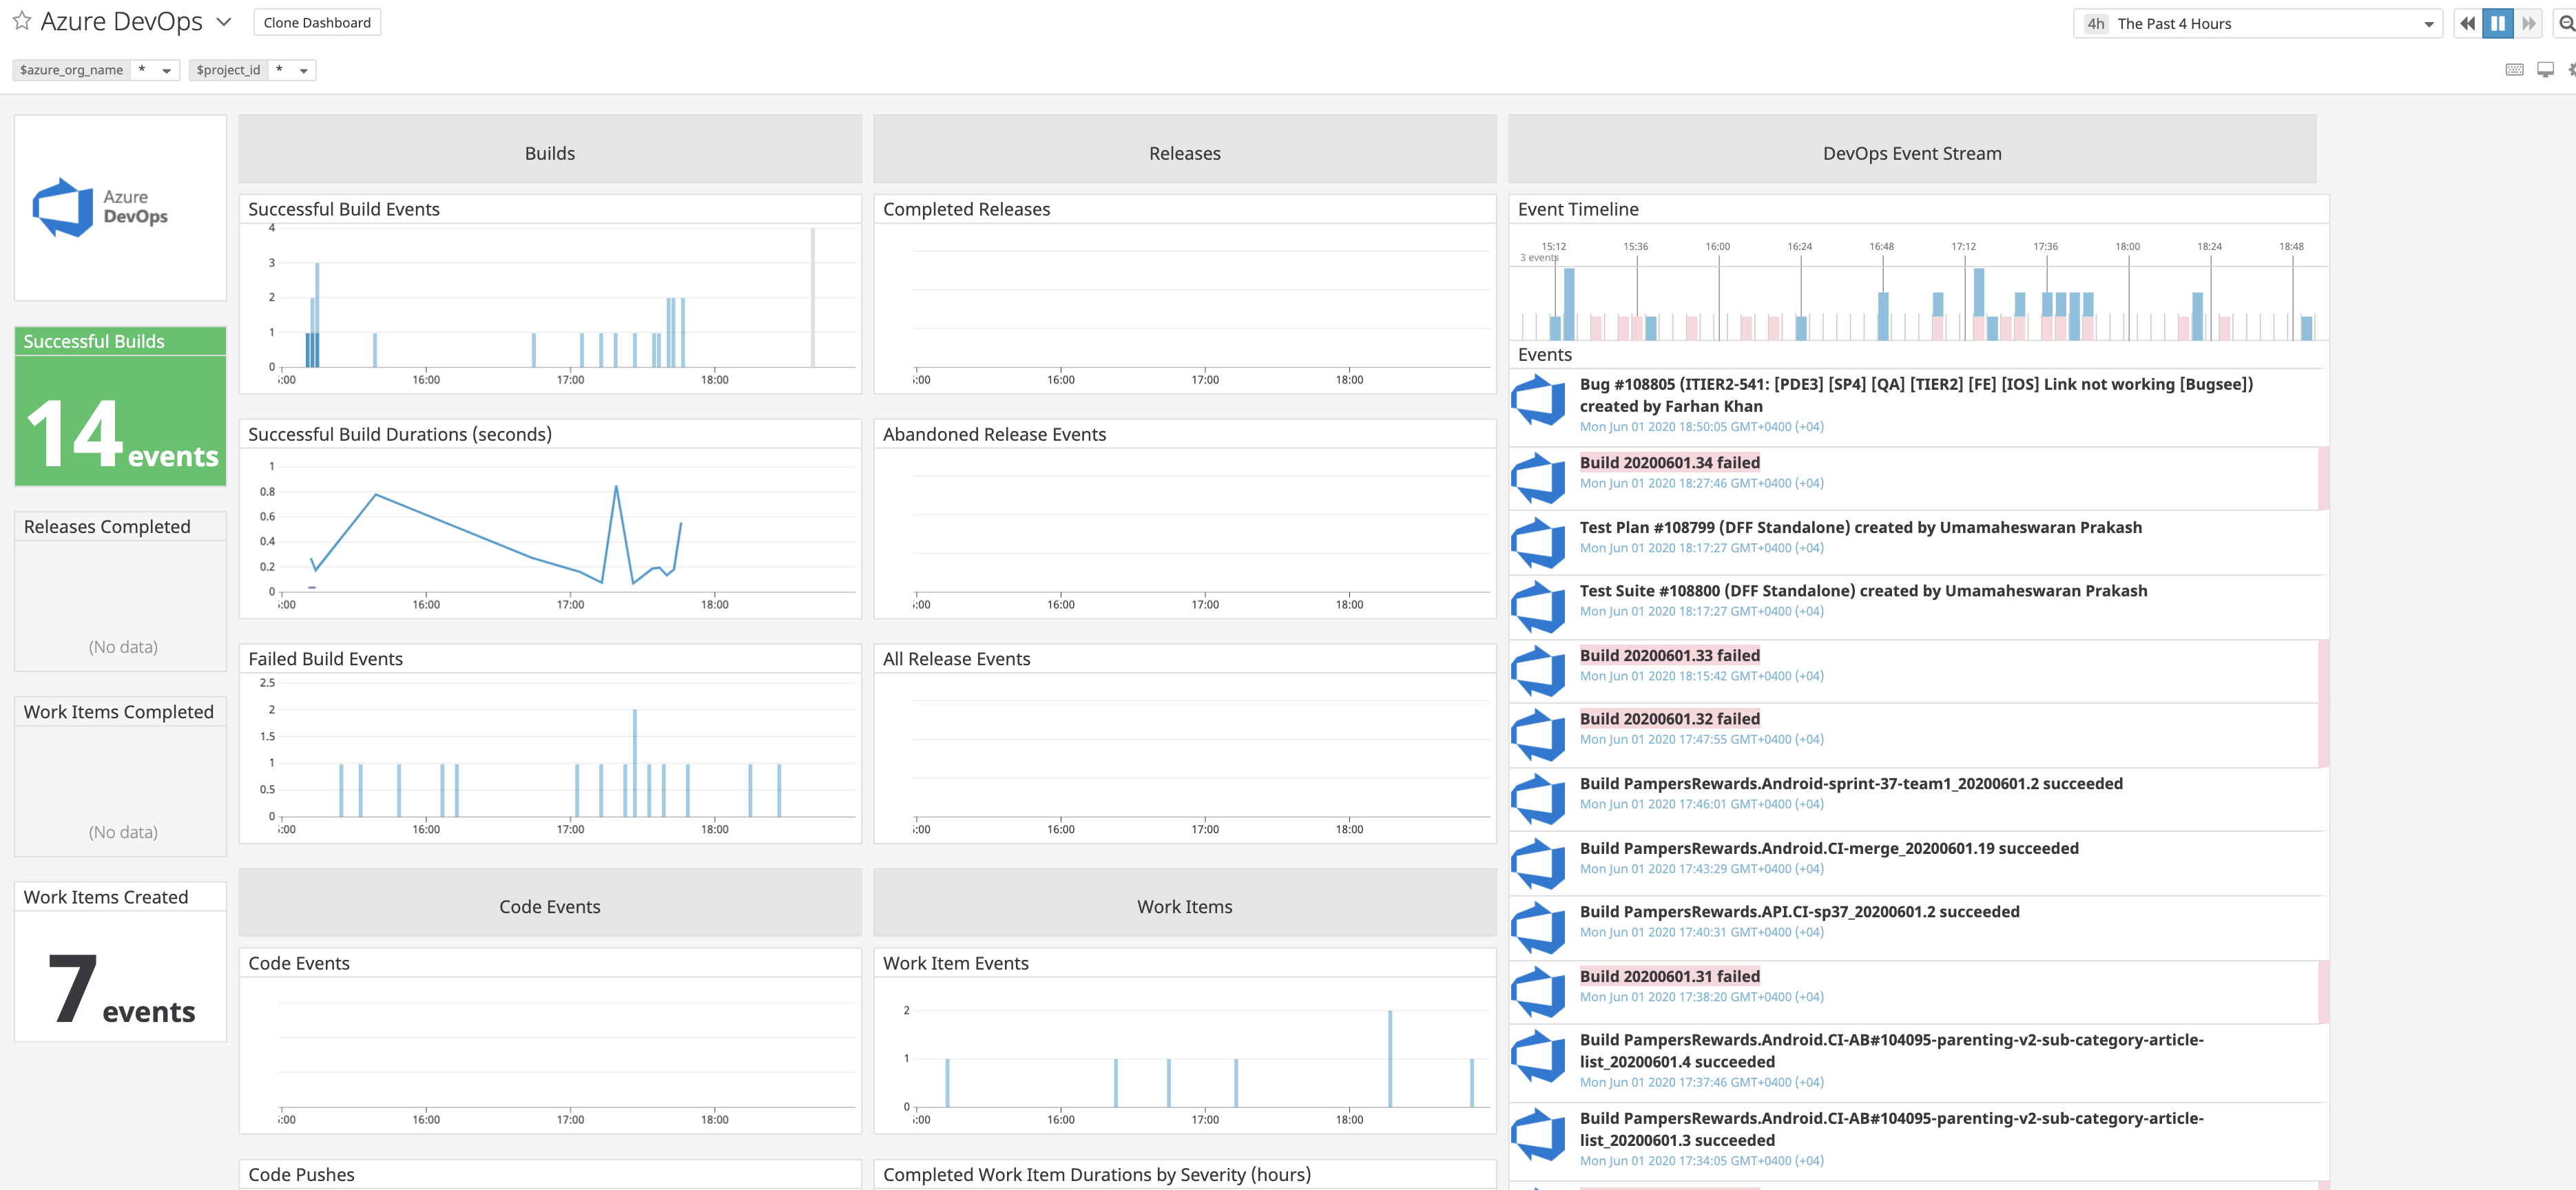
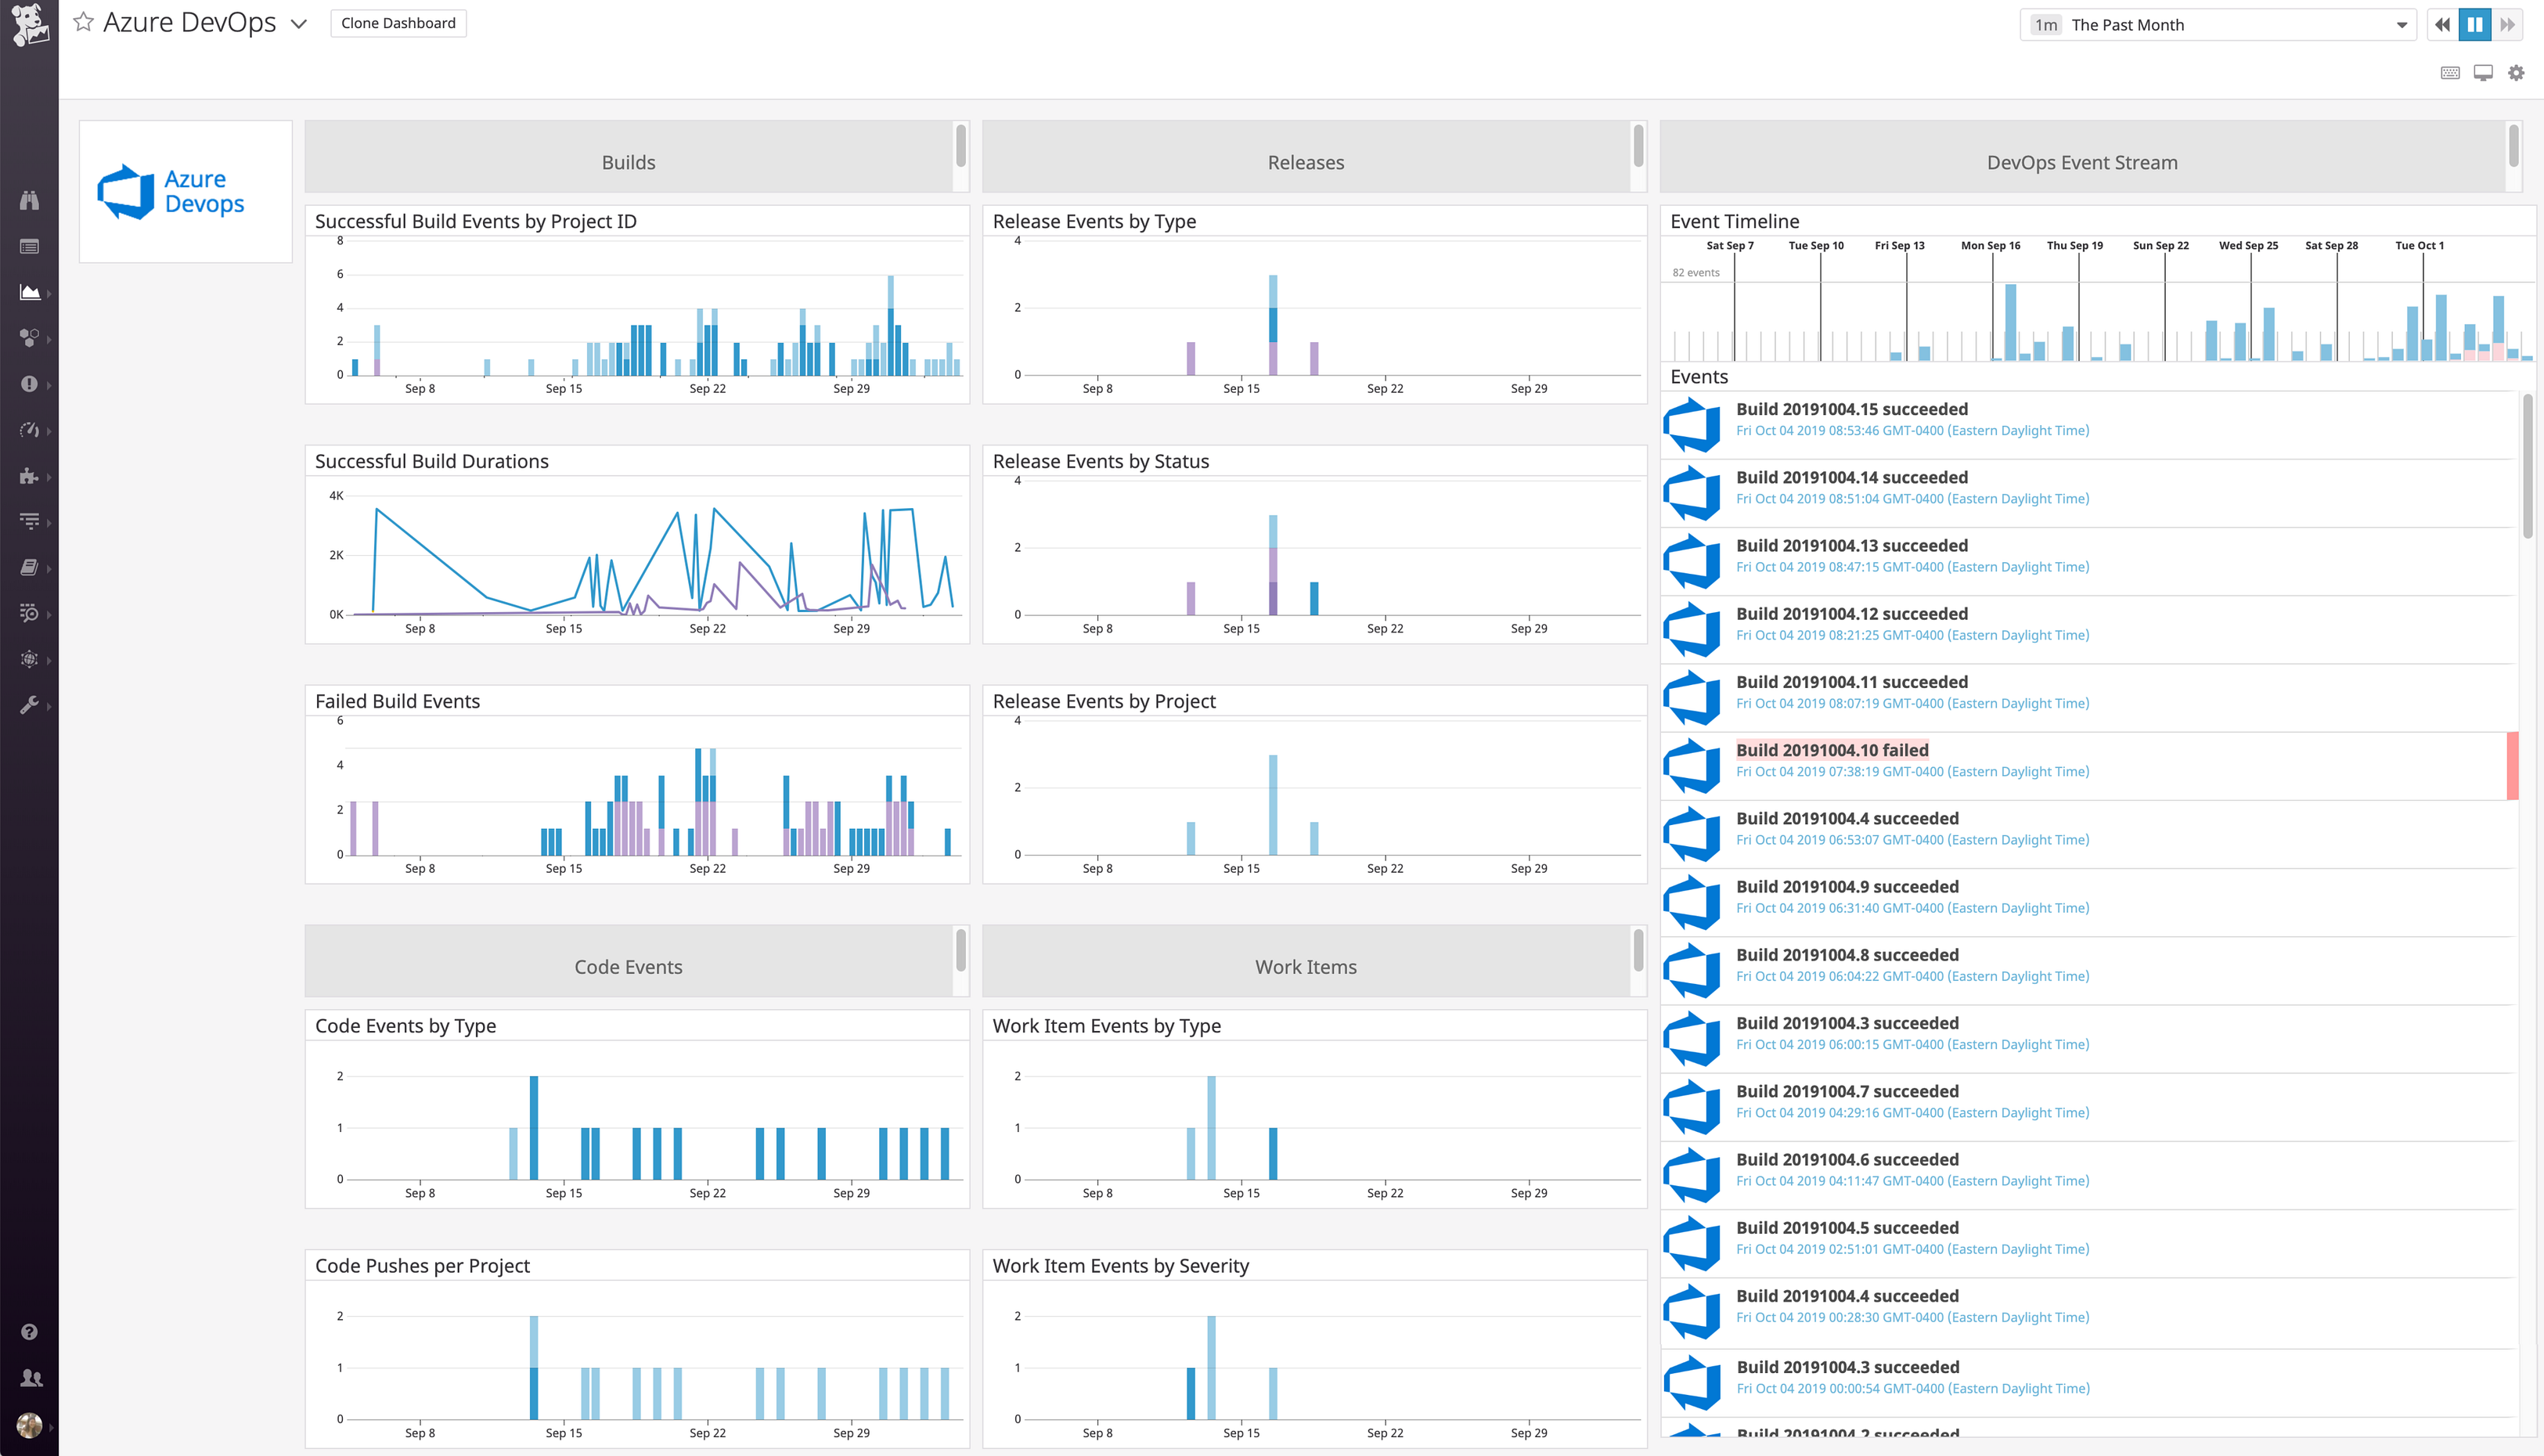
Once after all the steps are completed, we will be seeing the below Dashboard which is our real-time monitoring.

Related/References
- [AZ-400] Azure DevOps Certification Path
- [AZ-400] Roles And Responsibilities As An Azure DevOps Engineer
- [AZ-400] Microsoft Azure DevOps Certification Exam: Everything You Need To Know
- [AZ-400] Microsoft Azure DevOps Training: Step By Step Activity Guides/Hands-On Lab Exercise
- [AZ-400] Azure DevOps Services for Beginners
- Azure DevOps Service Hooks | Subscription Of Service Hooks | Release Approvals
- SonarCloud Azure DevOps | Integrating SonarCloud In Azure
- Azure DevOps Environments | How To Setup DevOps Environment | Approval Checks | Azure DevOps Pipeline
Next Task For You
Begin your journey toward Mastering Azure Cloud and landing high-paying jobs. Just click on the register now button on the below image to register for a Free Class on Mastering Azure Cloud: How to Build In-Demand Skills and Land High-Paying Jobs. This class will help you understand better, so you can choose the right career path and get a higher paying job.

Leave a Reply