![]()
Google Cloud Operations Suite includes several tools and services to help with monitoring, troubleshooting, and improving the performance of cloud-based applications.
This post will talk about Google Cloud Operations Suite, formerly known as Stackdriver, and its various features.
Stackdriver
Google Stackdriver first became available for public use in 2016. It was offered as a SaaS (Software as a Service) solution, providing monitoring services for applications in the cloud. It also came with support for hybrid cloud and integration with Google Cloud, which made it easy for users to host their applications on Google’s cloud platform. The supported features in Google Stackdriver included Stackdriver Monitoring and Stackdriver Logs.
 In 2020, Google changed the name of Google Stackdriver to Google Cloud Operations Suite, and changed the names of the supported services accordingly. Stackdriver Monitoring and Stackdriver Logs were changed to Cloud Monitoring and Cloud Logs respectively. This was done in an attempt to integrate all services with the existing Google Cloud Platform, allowing for users to have a more consolidating experience of the Google ecosystem.
Cloud Operations Suite
Google Cloud Operations Suite is a set of services for monitoring various resources. It is used to know about the behavior of the various cloud applications and find the cause of any issues plaguing them. As of now, it supports two of the most popular platforms available – Google Cloud Platform (GCP) and Amazon Web Services (AWS).
Operations Suite allows the user to
- Collect metrics, logs, and traces across Google Cloud and the cloud applications
- Monitor cloud applications using dashboards and views
- Query and analyze the said signals
- Set up various performance and availability indicators
- Set up alerts and notification rules with the existing systems
Read More: About IAM Google Cloud Platform. Click here
Agent Policy
While working with Operations Suite, one may be involved with several Compute Engine instances and might need to collect data from all of them. Manually doing that job becomes unfeasible, hence, an Agent policy is used to collect that data. The job of this policy is to automate the collection and maintenance of data from the various Virtual Machines (VMs). With the help of a single command, a user can set the policy for all the VM instances – both existing and upcoming.
 There are three kinds of Agent policies available –
- Monitoring Agent
- Logging agent
- Ops agent.
The first two, as the names suggest, are for sending monitoring and logging data to the VMs respectively. Ops agent, however, combines both logging and metrics into one agent and is especially useful for higher workloads.
Agent policies can be applied to a variety of Operating Systems, including CentOS, Debian, and Ubuntu. While an Agent policy may be applied to a Windows VM as well, it would only support an Ops agent.
Check Out: Our previous blog post on Google Cloud Functions. Click here
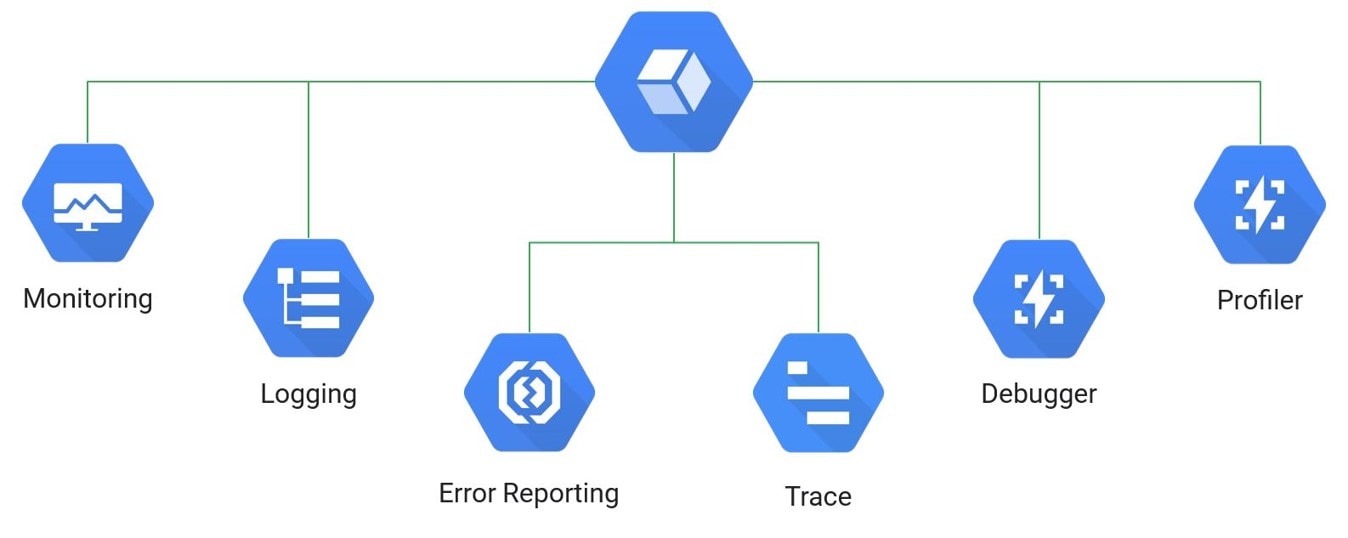
Operations Suite Components
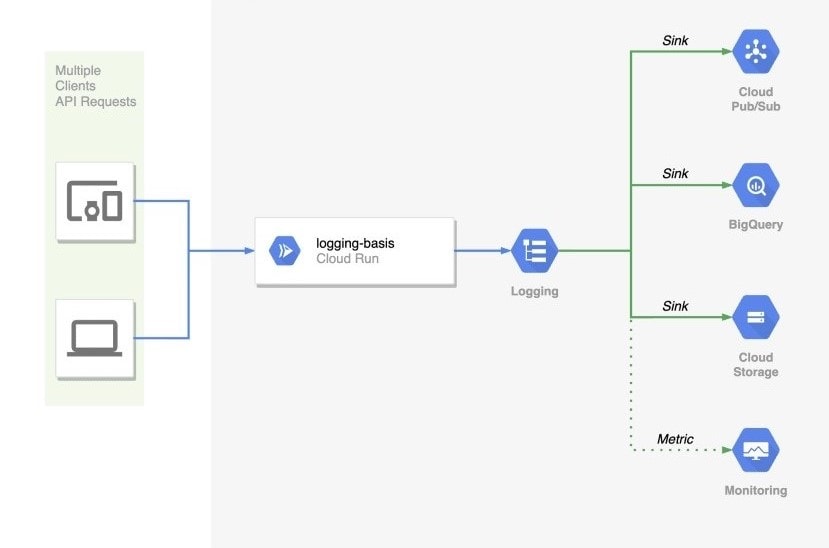
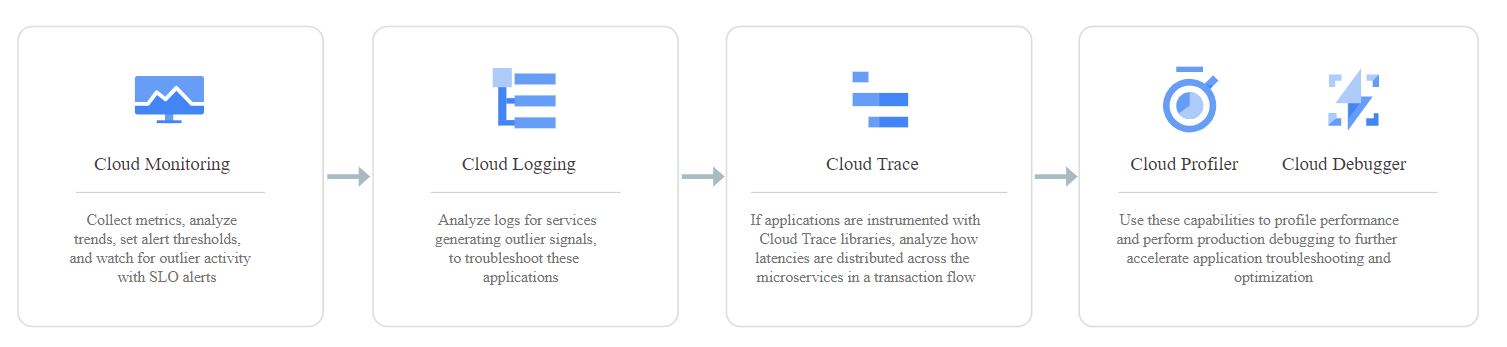
Operations Suite consists of a collection of managed services that are designed to make the observation of cloud applications easier. There are six such services, as shown in the diagram below. Let’s take a deeper look into these components.
Read More: About Google Cloud Database Services. Click here
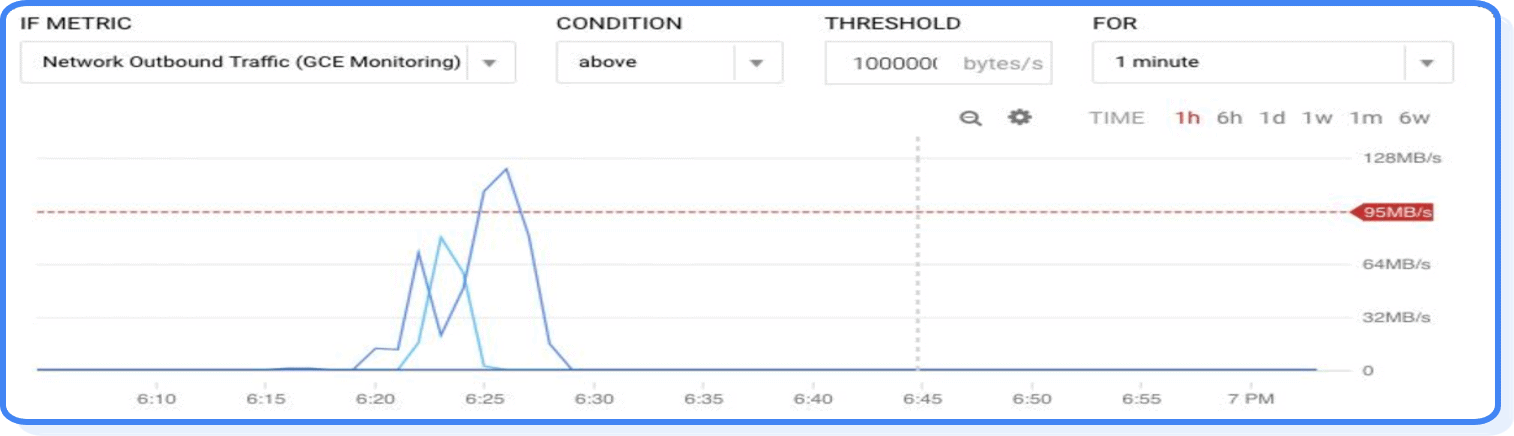
1.) Cloud Monitoring
Google Cloud Monitoring is a service to collect metrics, events, and metadata from supported cloud platforms (GCP and AWS). This data is then imported by Operations Suite and used to generate insights in the form of dashboards, alerts, and charts.
Cloud Monitoring is a great way to look into application performances, as is evident by its following features:
- SLO Monitoring: Applications are alerted automatically when violations to rules/policies occur
- Google Cloud Integration: Seamless integration with all google resources and services into Cloud console
- Logging Integration: Alerts can be created on log data based on collected metrics
- Dashboards: Ability to see into cloud resources and services without any additional configuration
- Group/Cluster Support: Relationships can be defined based on names, tags, projects, regions, etc. and then used to create dashboards & policies
- Uptime Monitoring: Availability of URLs, VMs, APIs, and LBs can be monitored
Pricing
All Cloud Monitoring features are free to use until the first 150MB of each billing account. After that mark is reached, additional metrics data is chargeable at $0.258/MB.
Check Out: Our previous blog post on Google Cloud Associate Cloud Engineer. Click here
2.) Cloud Logging
Cloud Logging is a service that can take application data, system log data, and custom log data from GKE environments, Compute Engine instances, and Google Cloud services. With Cloud Logging, one can analyze the said logs, and hasten the troubleshooting for the concerned cloud application.
Cloud Logging has an impressive set of features, some of which are:
- Logs Viewer: Flexible query statements can be used to search, sort, and query logs
- Custom Logs: Custom logs can be written from any source into Cloud Logging
- Advanced Analytics: BigQuery can be used for real-time data export and SQL like querying
- Third-Party Integrations: Can use Pub/Sub to integrate with external systems
- Logs Archival: Option to export logs to Cloud Storage for longer storage
- Log Buckets and Views: Logs can be centralized or divided based on the user’s needs using Log Buckets
Pricing
All these features by themselves are free to use, including the first 50 GB of data used by the project. Once that limit is reached, $0.50/GB is charged for further logs.
Check Out: How to create Free Google Cloud Trial Account. Click here
3.) Error Reporting
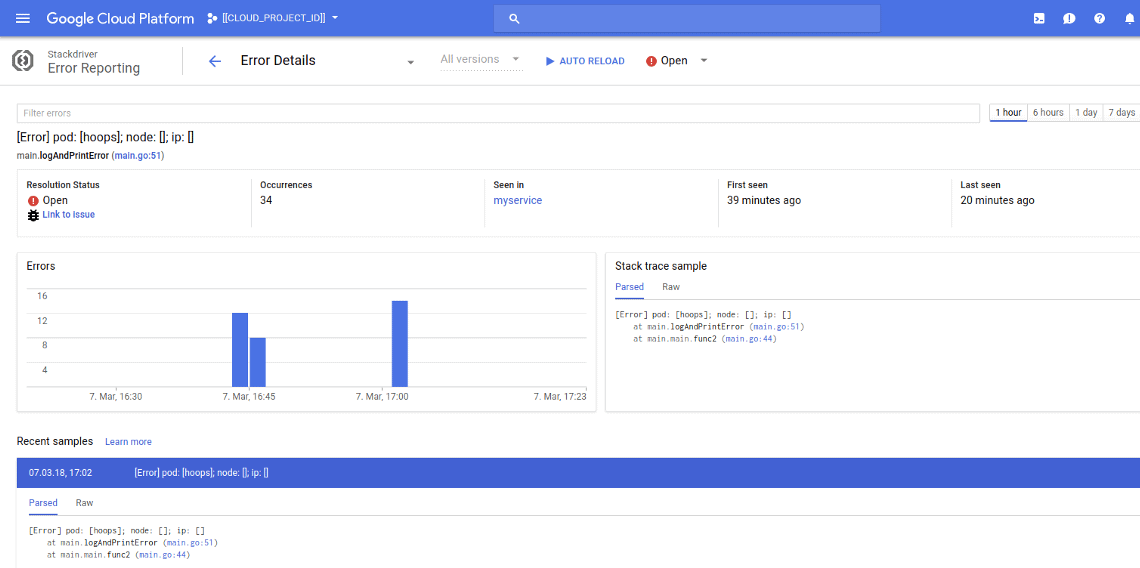
Error Reporting is one of the services offered under Google Cloud Operations Suite, which compiles and shows the errors produced in the cloud-based applications. Using its interface, the user can find the errors and list them in various ways, so that they may solve them accordingly.
The Error Reporting interface can list all the issues based on type or date. They can be further be filtered by version or error resolution status. Users can also enable notifications for when new errors occur.
There are two ways to report errors in cloud-based applications. The first is to directly send them to Cloud Logging yourself. However, this requires the need for proper formatting of the error report, which makes it more complex. The simpler way is to call an Error Reporting API endpoint that makes the report and sends them automatically.
Also Check Our blog post on Google Cloud Run. Click here
4.) Cloud Trace
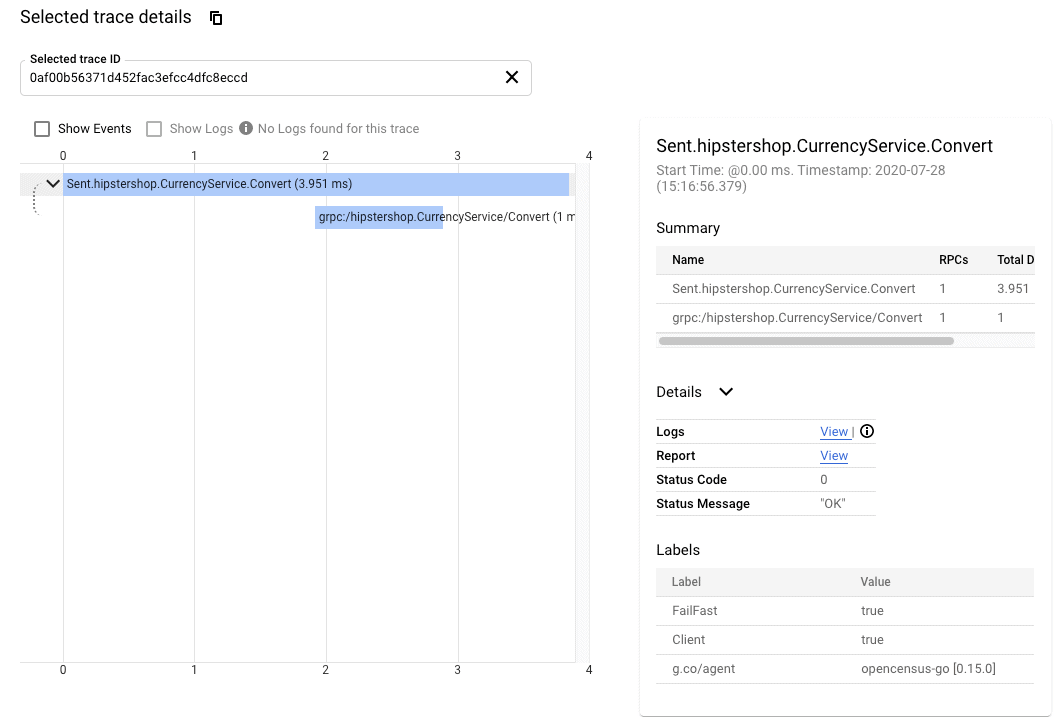
Cloud Trace is a system for collecting latency data for the applications and then displaying them in the Google Cloud Console. The analysis for all the application’s traces is done automatically, and the results displayed in form of latency reports. These traces can come from any VM, container, or App Engine project being used.
Google Cloud Trace can analyze traces coming from multiple platforms(GCP, AWS) and written in multiple languages. The languages supported currently are Java, Node.JS, Ruby, and Go. It also captures App Engine projects automatically. Finally, Cloud Trace offers the following features:
- Easy Setup
- Performance insight
- Automatic Analysis
- Extensibility (for custom workloads)
- Latency Shift Detection
Also Read: Cloud Spanner vs Cosmos DB, Know their major differences!
5.) Cloud Debugger
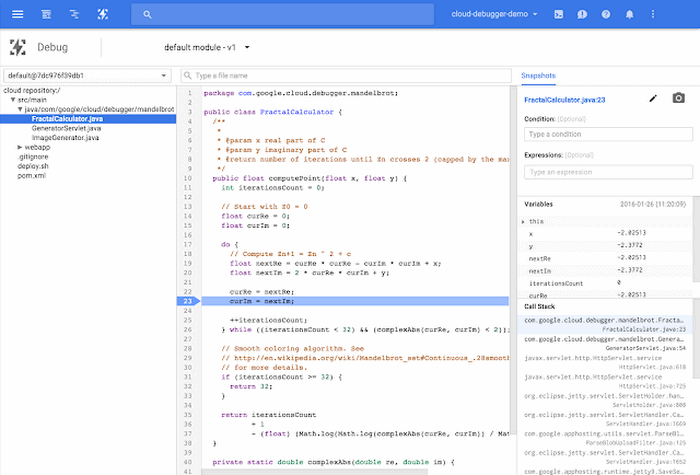
Cloud Debugger is an offering under Operations Suite that allows for real-time inspection of a running application. It is helpful to find bugs that only show up during runtime, and then work on resolving them. Any work done on the source code through Cloud Debugger does not affect the application frontend.
Cloud Debugger is used with applications that are in production. It works by taking snapshots of the application’s state and then adding or editing logging statements to it. Cloud Debugger supports multiple source options for the code, for instance, Cloud Source Repositories, GitHub, BitBucket, etc; while also having support for local file uploads. It is also possible to team up with other people while using Debugger. Some of the features offered by Cloud Debugger are:
- Debug snapshots
- Debug logpoints
- Conditional debugging
- IDE integration
- Easy setup
Also Read Our previous blog post on Google Cloud Services. Click here
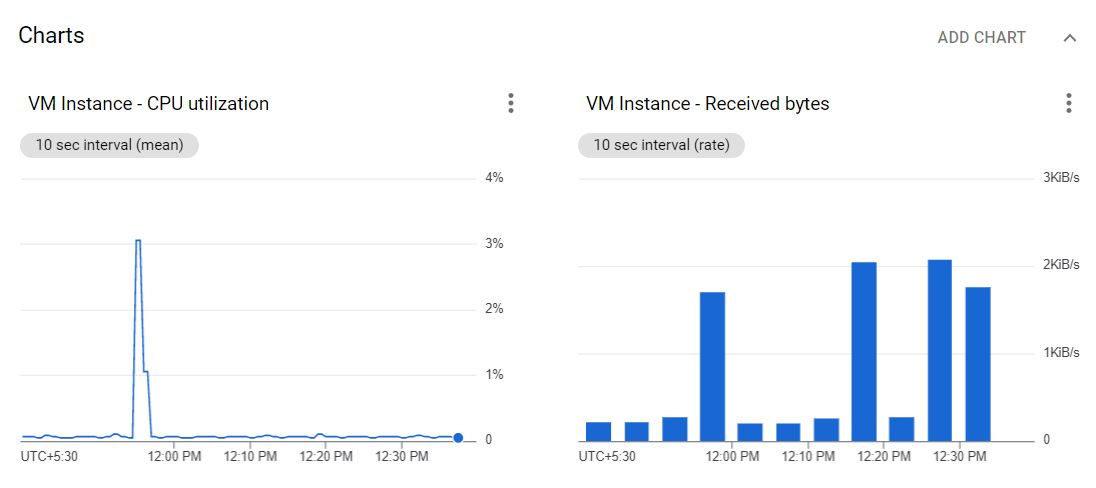
6.) Cloud Profiler
Cloud Profiler is another service offered under Operations Suite used for continuous monitoring of the application. The main job of the Profiler is to gather CPU and memory usage metrics. This helps in identifying which part of the application is taking up the most resources, so that appropriate the said part of the code might be changed. All these features come free of cost and are fully included in Cloud Operations Suite.
Read More: About Google Cloud Certified Professional Cloud Architect. Click here
Application Performance Management (APM)
Application Performace is used to combine the two main functionalities offered by Operations Suite (monitoring and troubleshooting) into one using options like Cloud Monitoring, Cloud Logging, Cloud Trace, Cloud Debugger, and Cloud Profiler. This is done to make the application more efficient with respect to both cost and time.
Conclusion
Cloud Operations Suite works on applications and infrastructure hosted on cloud platforms. The various Cloud Operation features are always on, keeping track of the said applications. The various logs and metrics are compiled and can then be used elsewhere. Google Cloud services like Pub/Sub, BigQuery, and Google Cloud Storage can make use of the data provided by Operations Suite to improve performance and resolve errors.
Google Cloud Operations Suite offers great options to monitor and troubleshoot the applications in the cloud. As we saw, most of the services available automate a variety of processes, for maximum efficiency on the developer’s part, while still not hampering the user experience.
Also Read: Our blog post on GKE Cluster. Click here
FAQs
Is Operations Suite the same as Stackdriver?
Operations Suite is the new name for Stackdriver. Google has added a few extra features, plus better integration with Google Cloud services, to make it easier for users on GCP.
Do Operations Suite services incur extra charges?
Google Cloud Operations Suite, just like most other Google Cloud services, has usage-based pricing. Services like monitoring and logging come with a free tier, after which charges are levied. Profiler and Debugger are completely free to use. Services like Trace are pay-per-use from the start.
Does Operations Suite require any expertise from users for management?
Most of Operation Suite services are automated from Google's end, meaning they require little to no human intervention once the initial settings are done.
Related References
- GCP Professional Cloud Architect: Everything You Need To Know
- Google Cloud Services & Tools
- Google Cloud Platform Console Walkthrough
- Google Cloud Functions
Next Task For You
If you are also interested and want to know more about the Google Professional Cloud Architect certification then register for our Free Class.
Leave a Reply