![]()
Kubernetes monitoring is a method of examining and reporting the health status of cluster components. So, the process helps track the utilisation of cluster resources, including memory, CPU, and storage. And, talking of open-source tools like Prometheus for Kubernetes monitoring and Grafana for visualising have become the numero uno go-to tools!
Let’s look at the topics discussed in this post:
- Kubernetes Dashboard
- What is Prometheus Kubernetes?
- Prometheus Architecture
- How does Prometheus work?
- What is Grafana?
- Install Prometheus and Grafana
- Conclusion
Kubernetes Monitoring
Kubernetes Monitoring
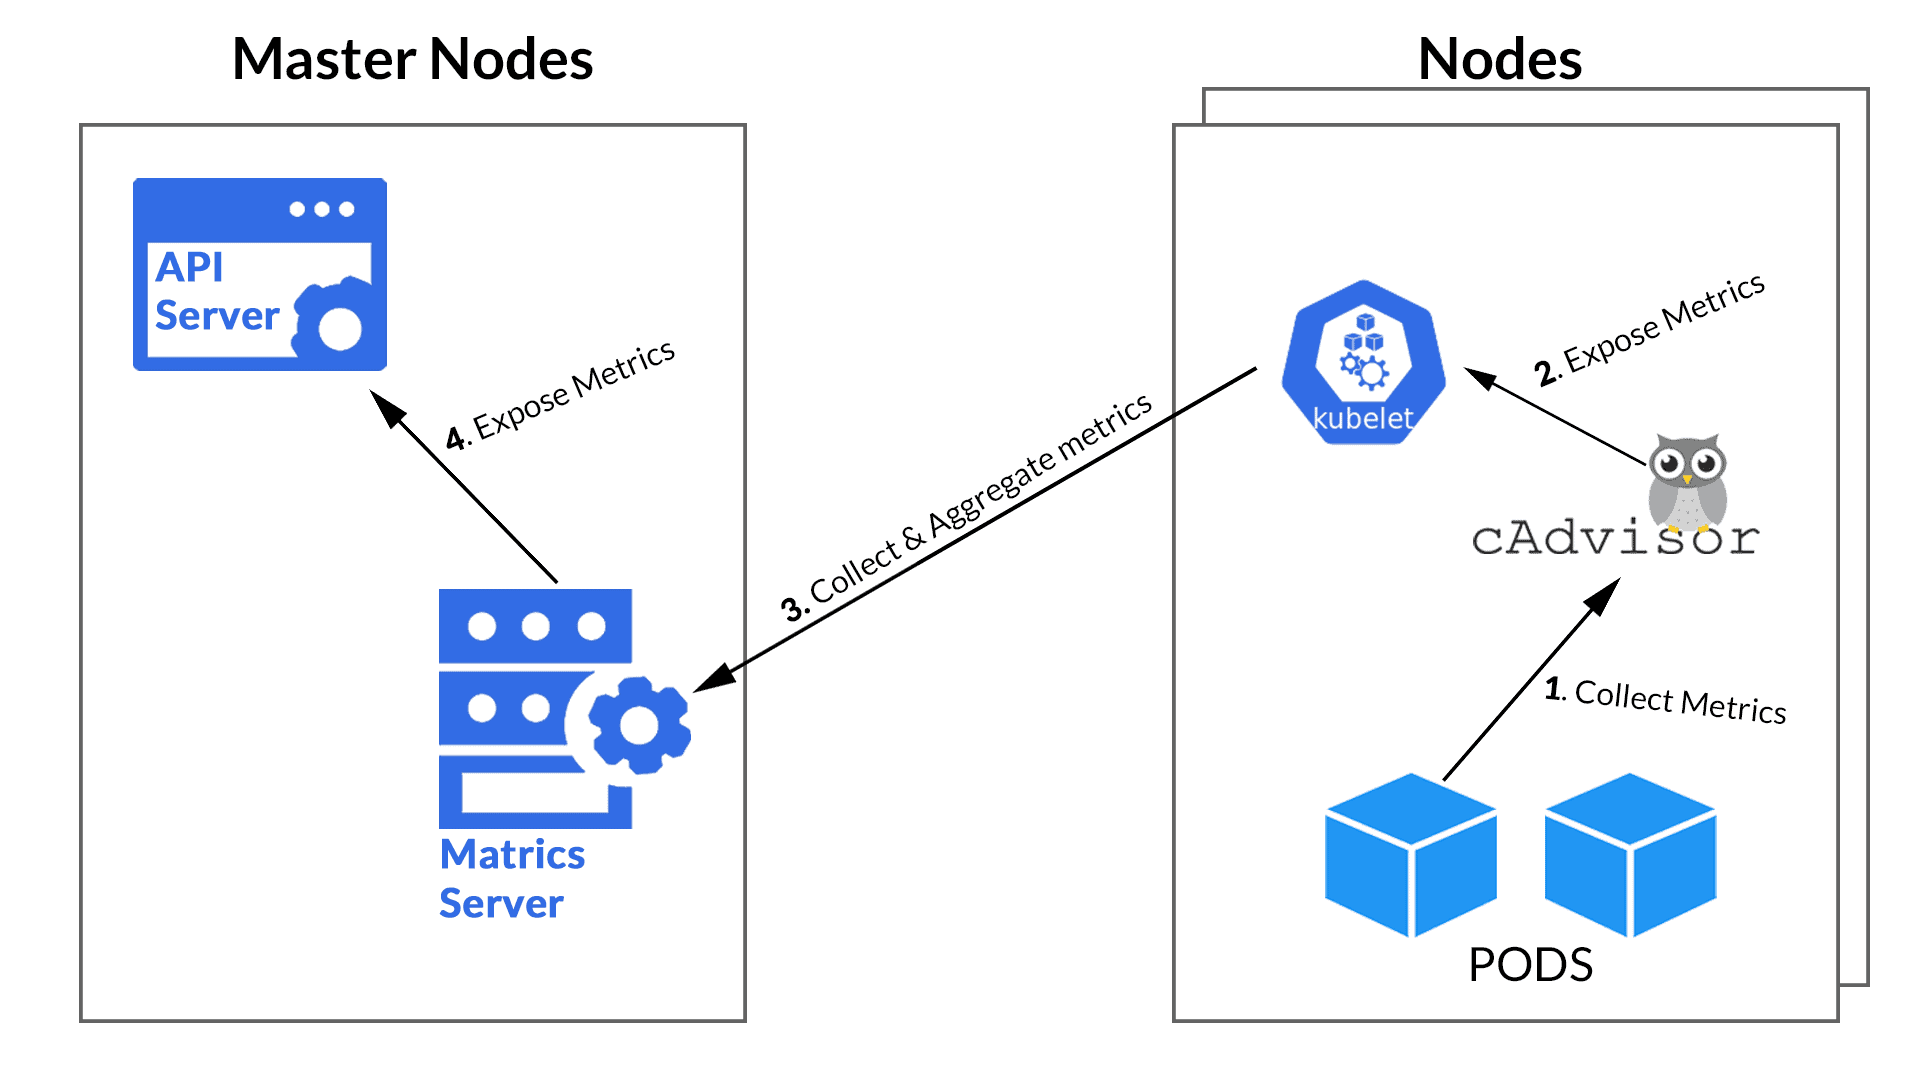
The challenge with Kubernetes comes from the managing of high availability, performance, and deployment of containers. But, what is more, the challenge is also to monitor them. Thankfully, K8s comes up with Metrics. The CAdvisor, installed by default on all cluster nodes, collects containers like CPU, memory, network, and disk usage. These metrics are pushed into the Metric Server of Kubernetes by the kubelet APIs.
Kubernetes eases the management of our containerised applications and services. It can sometimes be a two-edged sword, as it adds complexity to the system with the influx of new layers and abstractions. Hence, it makes a long list of components to monitor.
But to our rescue, there are many excelling open-source tools in today’s world to help us get through with the monitoring.
Kubernetes Dashboard
The web-based Kubernetes console, which is a general-purpose UI made to look after the Cluster in Kubernetes. Surprisingly, even the dashboard is nothing but a container that access the cluster information from within the cluster. So, it’s just another resource for Kubernetes to manage.
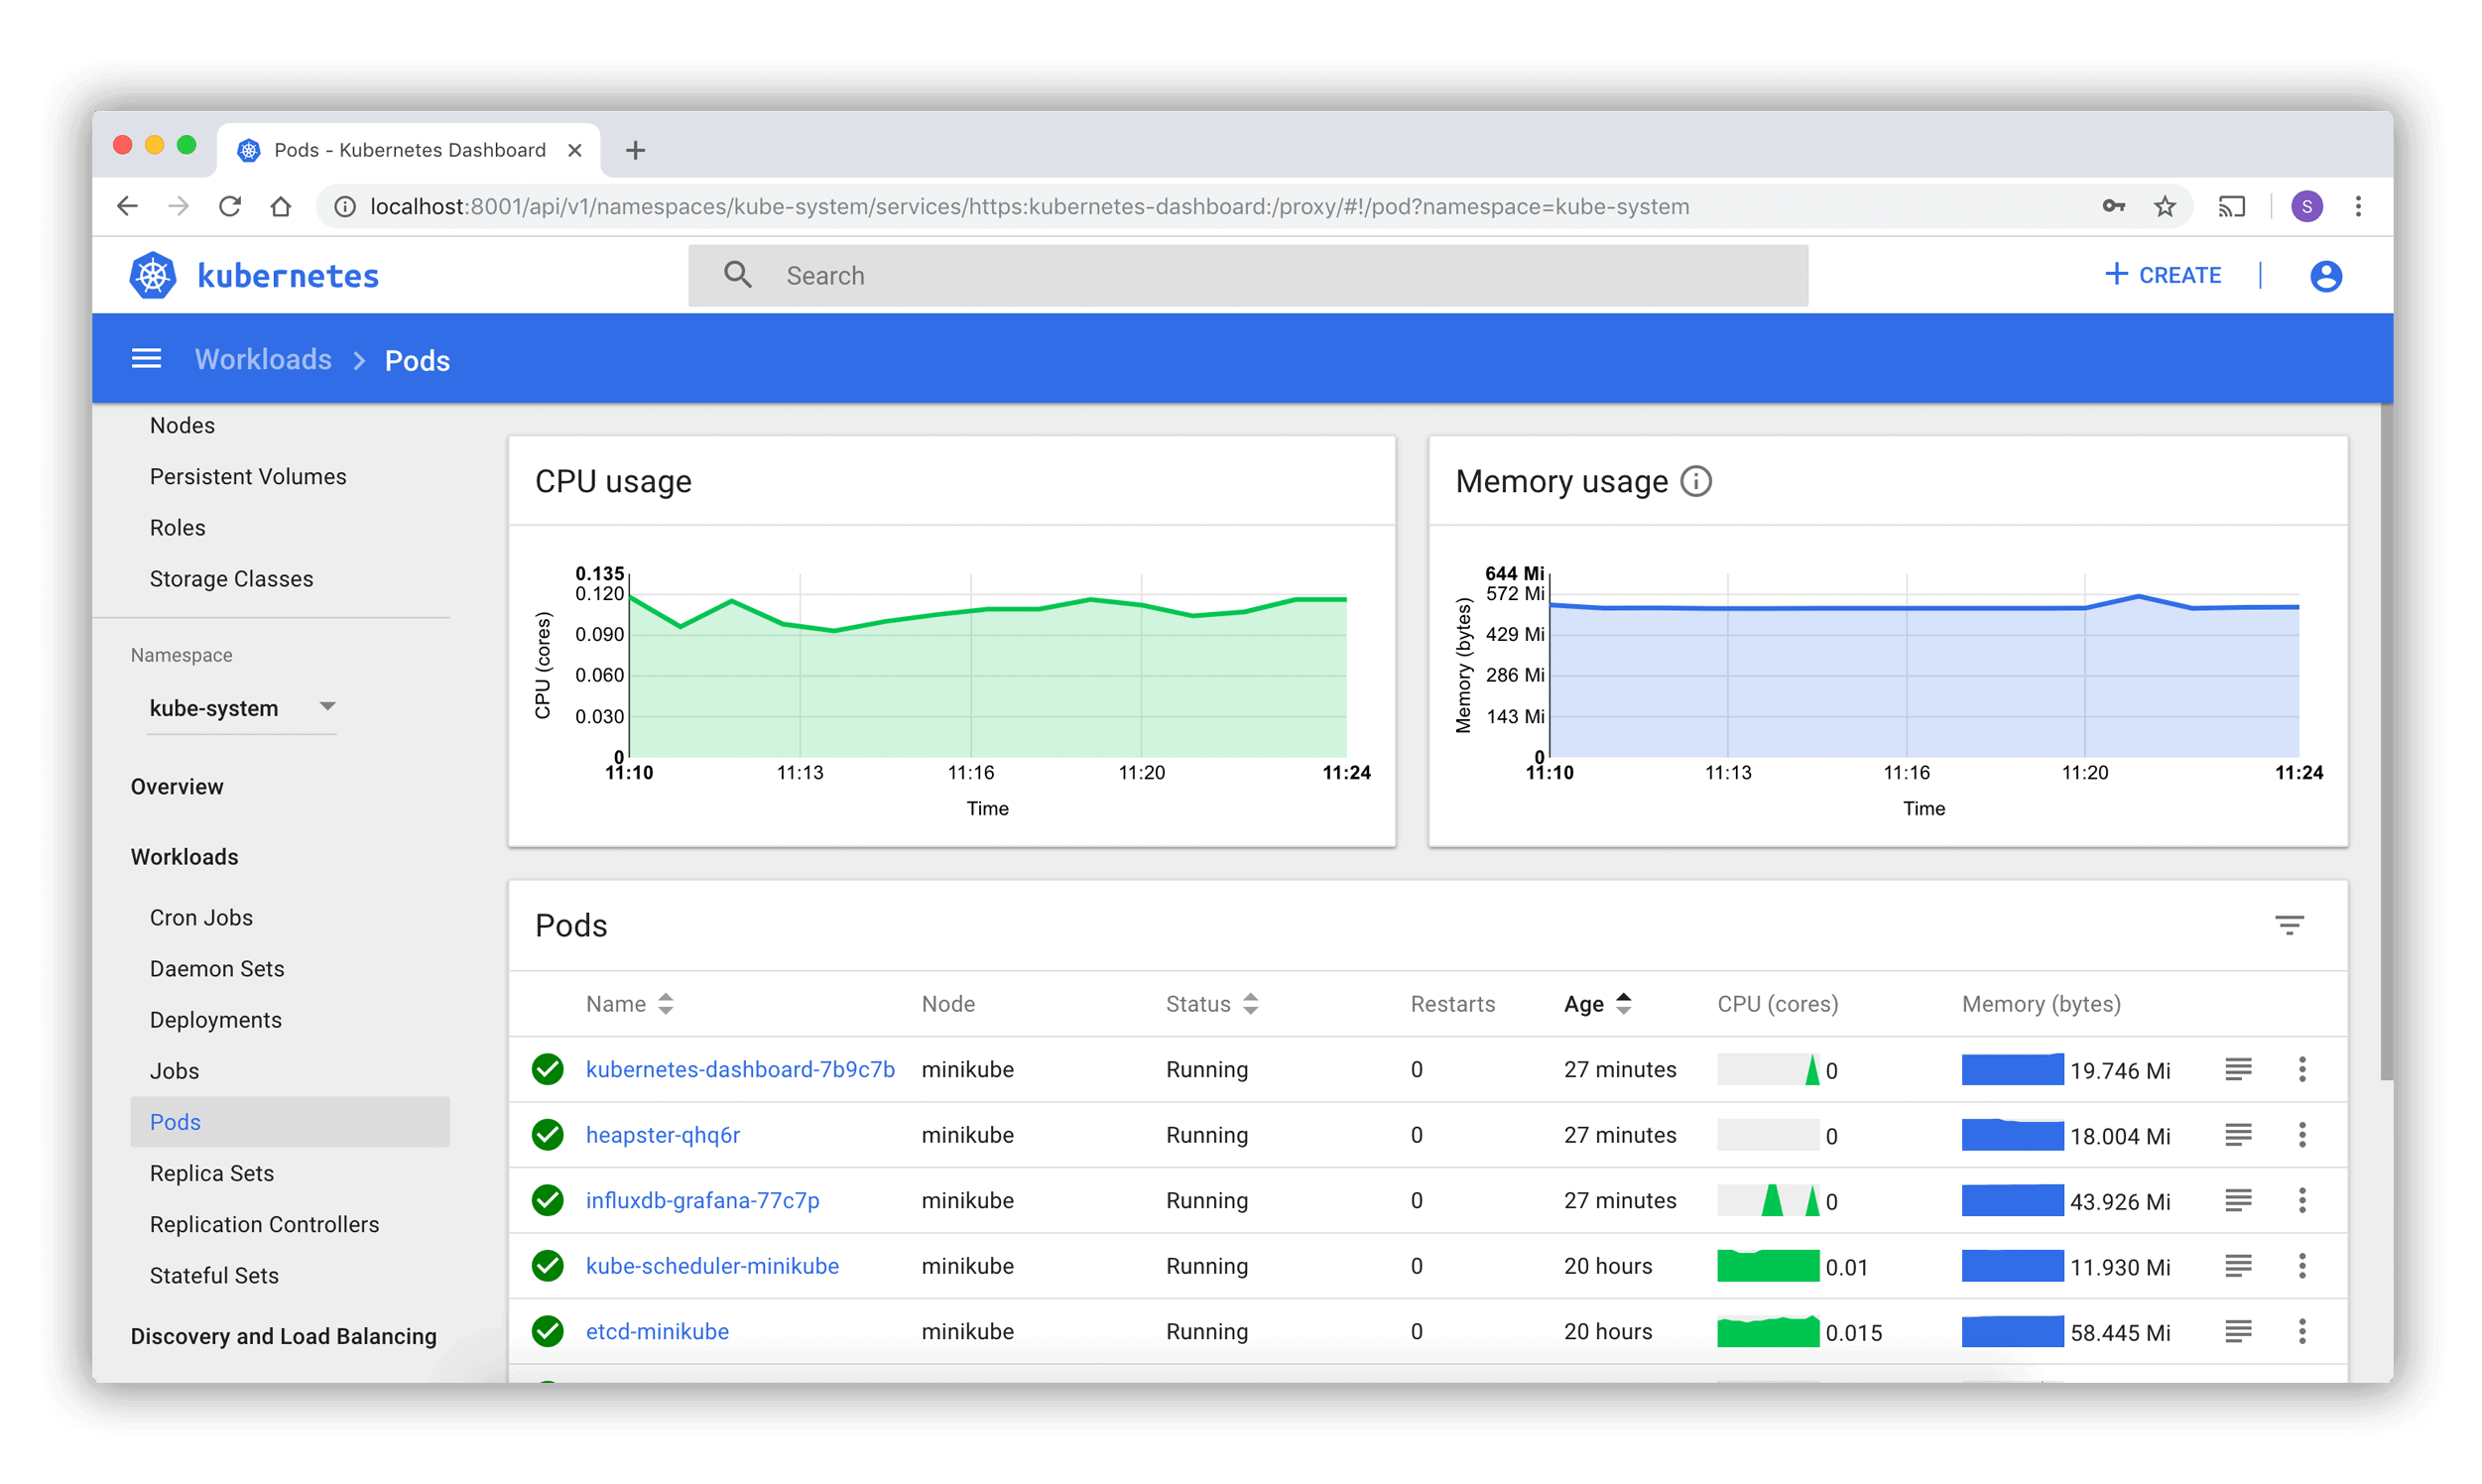 Kubernetes Dashboard
Also Check: Our blog post on Kubernetes Deployment. Click here
What is Prometheus Kubernetes?
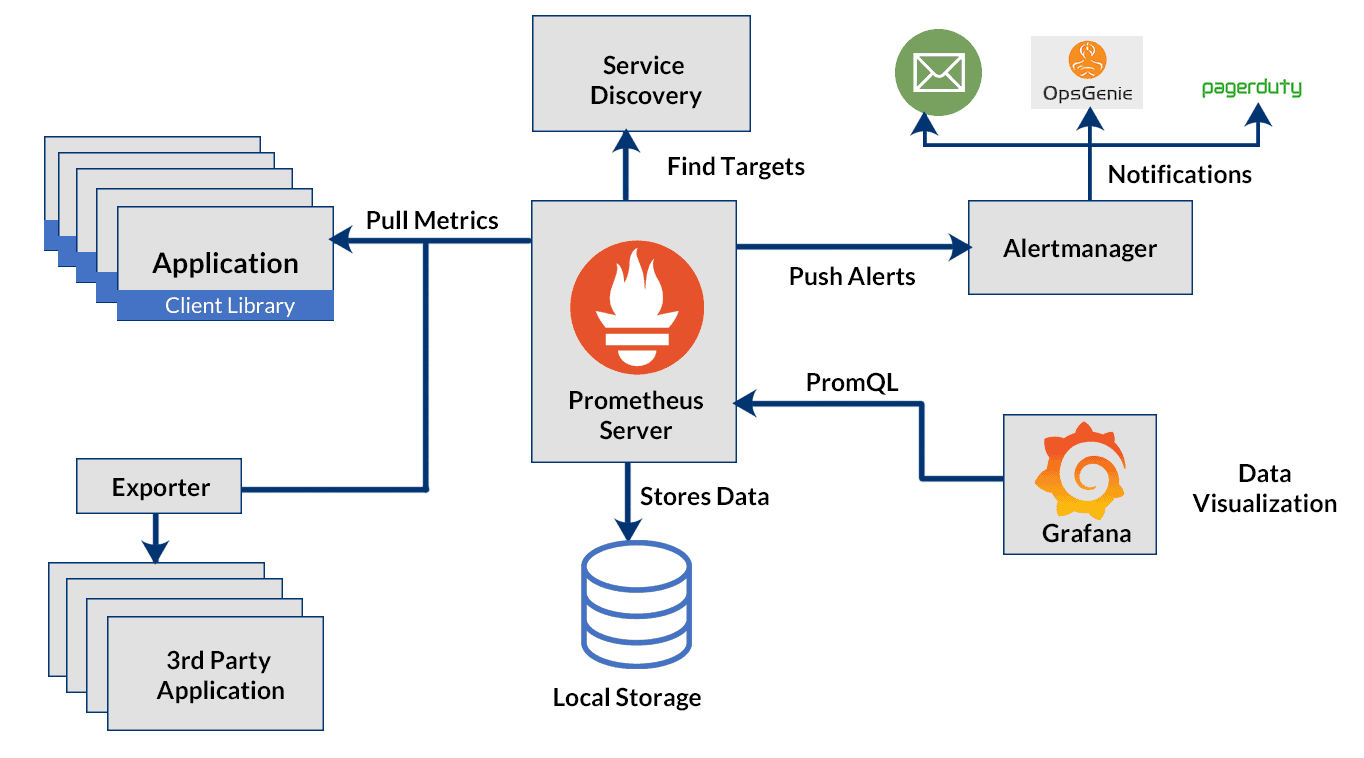
![]() An open-source monitoring tool, Prometheus seems to be the King 👑 of all the monitoring tools out there as of today. Prometheus on Kubernetes is used for metrics-based monitoring and alerting. It pulls the real-time metrics, compresses and stores them in a time-series database.
An open-source monitoring tool, Prometheus seems to be the King 👑 of all the monitoring tools out there as of today. Prometheus on Kubernetes is used for metrics-based monitoring and alerting. It pulls the real-time metrics, compresses and stores them in a time-series database.
The Prometheus sends an HTTP request (pull) called Scrape, found on the configuration in the deployment. It provides a query language and a robust data model that provides detailed and actionable metrics.
Let’s look at how is Prometheus built from the inside.
Prometheus Architecture
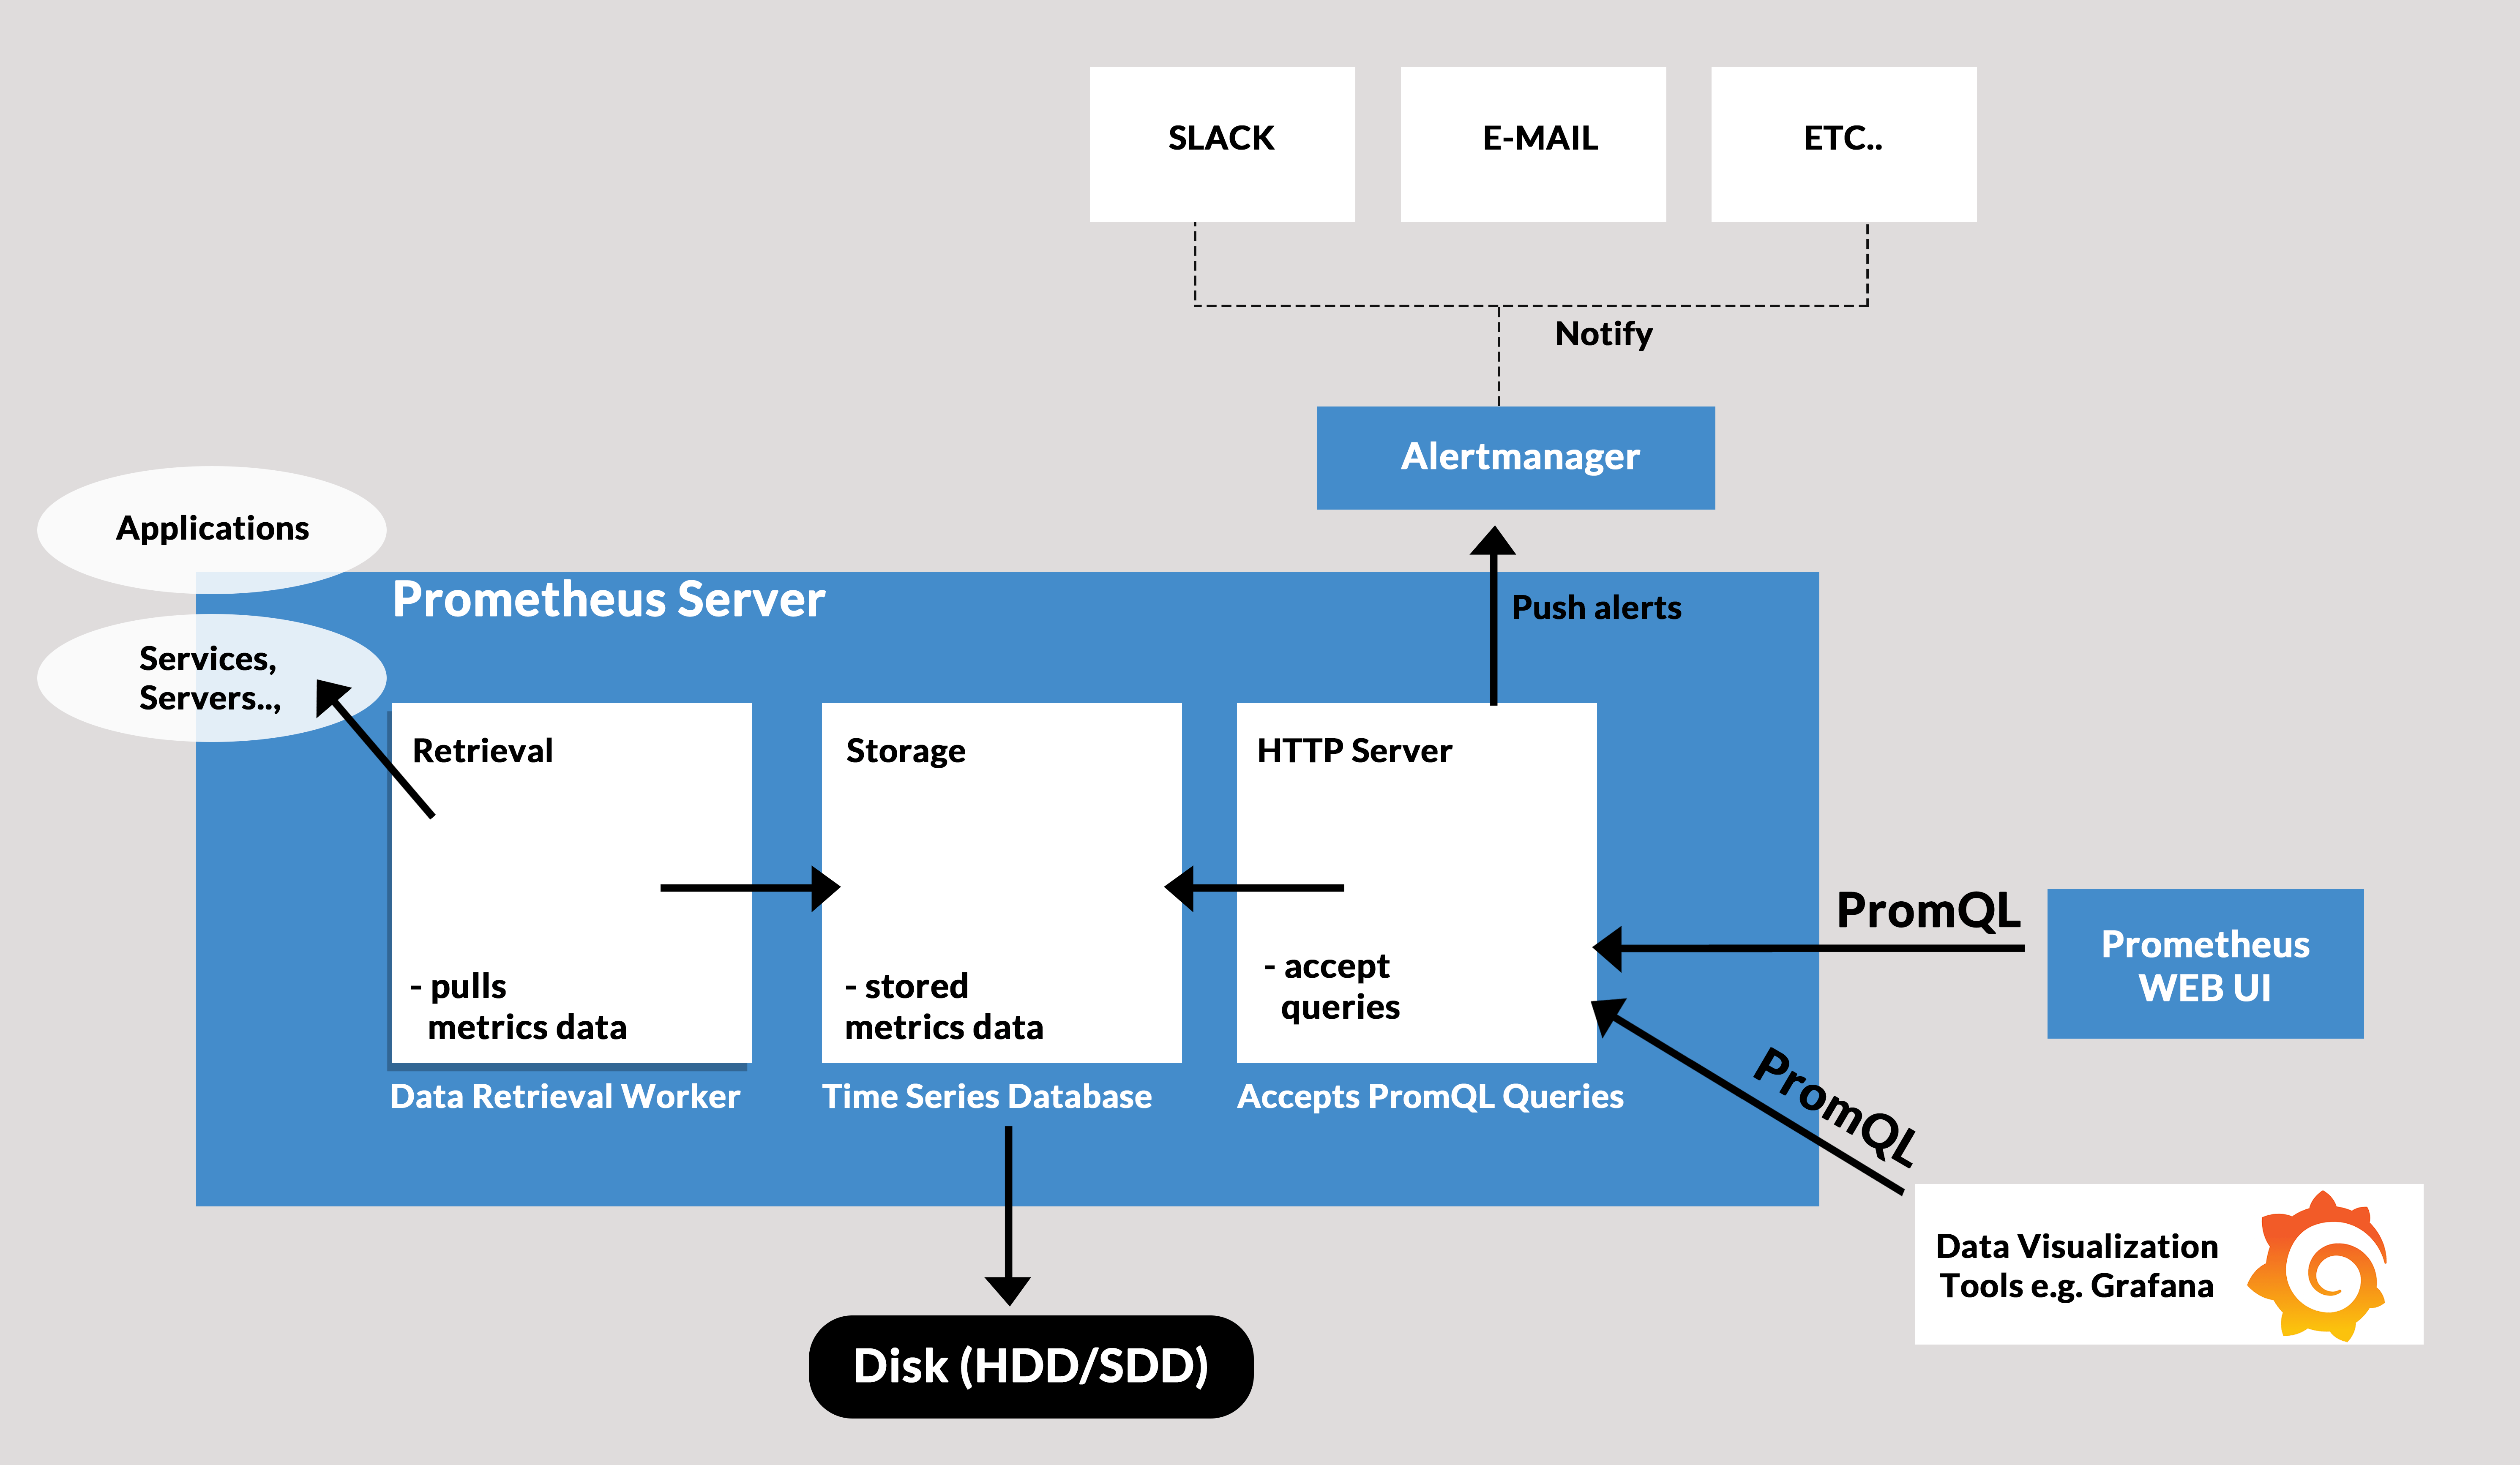
At its core, Prometheus has a main component called Prometheus Server, responsible for the actual monitoring work. The Prometheus server consists of:
- Time Series Database that stores all the metric data like current CPU usage, memory usage etc.
- Data Retrieval Worker is responsible for all the data pulling activities from applications, services, servers etc. and pushing them into the database.
- HTTP Server API meant to accept queries for the stored data. The Server API is used to display the data in a dashboard or a Web UI.
Prometheus Architecture
These three components together are the ones behind that scene that helps keep our K8s clusters healthy and perform the best.
Also Check: Kubernetes LivenessProbe
Why use Prometheus for Kubernetes monitoring
There were two technological changes that necessitated the development of a new monitoring framework:
DevOps culture: Monitoring comprised of hosts, networks, and services before the advent of DevOps. Now that developers are more active in the CI/CD pipeline and are capable of handling a lot of operations-debugging on their own, they require the flexibility to quickly integrate app and business-related metrics as an organic part of the infrastructure. It was necessary to democratise monitoring, increase accessibility, and extend it to more stack tiers.
Containers and Kubernetes: Monitoring is not an exception to how container-based infrastructures are fundamentally altering how we perform logging, debugging, high availability, etc. Now you have a sizable number of services, virtual network addresses, exposed metrics, and volatile software entities that can arise or disappear at any time. The use of conventional monitoring tools is not intended for this.
Prometheus became the de facto standard for Kubernetes monitoring due to these four features:
- Multi-dimensional data model: The structure of the model is based on key-value pairs, much as how Kubernetes labels infrastructure metadata. It powers the Prometheus query language and enables flexible and precise time series data.
- Accessible format and protocols: Making prometheus metrics available is a fairly simple process. Metrics are published utilising a common HTTP transport, are human readable, and have self-explanatory formats.
- Service discovery: Applications and services don’t have to worry about producing data because the Prometheus server is responsible for routinely scraping the targets (metrics are pulled, not pushed). There are numerous ways for these Prometheus servers to automatically find scrape targets. Some of them are ideal for ephemeral Kubernetes workloads because they can be set to filter and match container metadata.
- Modular and high available components: Different composable services carry out tasks like metric gathering, alerting, graphic presentation, etc. These services are all made to facilitate sharding and redundancy.
Challenges of microservices and Kubernetes monitoring
In order to implement dependable monitoring, alerting, and graphing architecture, specific obstacles related to monitoring a Kubernetes cluster must be overcome.
Monitoring containers (visibility): Due to their small weight and immutability, containers might be difficult to monitor.
By making internal Kubernetes information, such as the number of desired/running replicas in a deployment, unschedulable nodes, etc., publicly available, the Kubernetes API and the kube-state-metrics (which natively uses prometheus metrics) help to address a portion of this issue.
Prometheus is an excellent fit for microservices since only the metrics port has to be exposed; no other services or extra complexity need to be run. A developer typically just needs to add a new URL, like /metrics, if the service itself already presents an HTTP interface.
Dynamic monitoring (changing and volatile infrastructure):
Ephemeral entities that can report at any time are a difficulty for traditional, more static monitoring systems, as we previously noted.
To address this, Prometheus provides a number of autodiscovery techniques. The following are the most crucial to this guide:
- Consul: Consul is a service configuration and discovery tool. Consul is highly scalable, distributed, and highly available.
- Kubernetes: Kubernetes SD settings let you retrieve scrape targets from the REST API of Kubernetes and always keep track of the cluster state.
- Prometheus Operator: Using well-known Kubernetes label searches, the Prometheus Operator will automatically create monitoring target settings. Later, we’ll concentrate on this deployment strategy.
How does Prometheus work with Kubernetes?
Prometheus on Kubernetes monitors a ‘thing’, for instance, Linux/Windows server, an application, Apache server, service like a database. These are called the Targets.
Working of Prometheus
Metrics
The units monitored from these targets can be like the current CPU usage, memory usage, the number of counts of a request or an exception. These units are called Metrics. They are in a human-readable text-based format with TYPE and HELP attributes. The HELP attributes description of what the metrics are.
There are three types of metrics TYPES named:
- Counter: Tells us about how many times ‘x’ happened. It can be like the number of times an exception occurred or the number of requests.
- Gauge: It represents a metric that can go up and down. So, it gives us the value of ‘x’. An ‘x’ can be the current CPU usage, disk usage etc.
- Histogram: This type tracks the duration or the size of requests or any required metric.
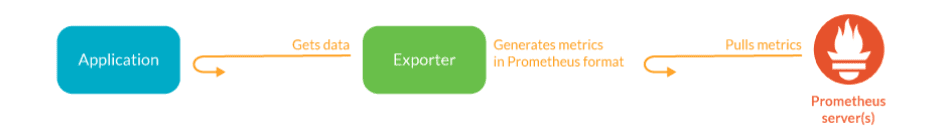
Prometheus on Kubernetes pulls metrics data from the targets. They pull data from HTTP endpoints like the host address/metrics. So, for this to work, the targets should expose their /metrics endpoint, and the data at the endpoint must be acceptable by Prometheus. But, not every service exposes their /metrics endpoint by default. So, then comes the Exporter. It is a script that does help the Prometheus server retrieve the metrics by doing the following work:
- Pulls the metrics from the target.
- Converts it into the Prometheus readable format.
- Exposes the /metrics endpoints.
So, these exporters help you scrape metrics when required and are readily available. There are many official Prometheus exporters for services like MySQL, Linux server, cloud platforms, etc. You can check it out from here 👈
Alerts Manager
The Prometheus has another component that alerts in a failure in the cluster, resource limitations etc. The Alert Manager is responsible for firing alerts via a different medium like Slack, email, etc.
Prometheus Data Storage
Prometheus on Kubernetes collects and aggregates all the data in a disk. So, it involves local storage but can also connect with remote storage. But we can’t directly store the pulled data on a relational database since it is in a custom time-series format.
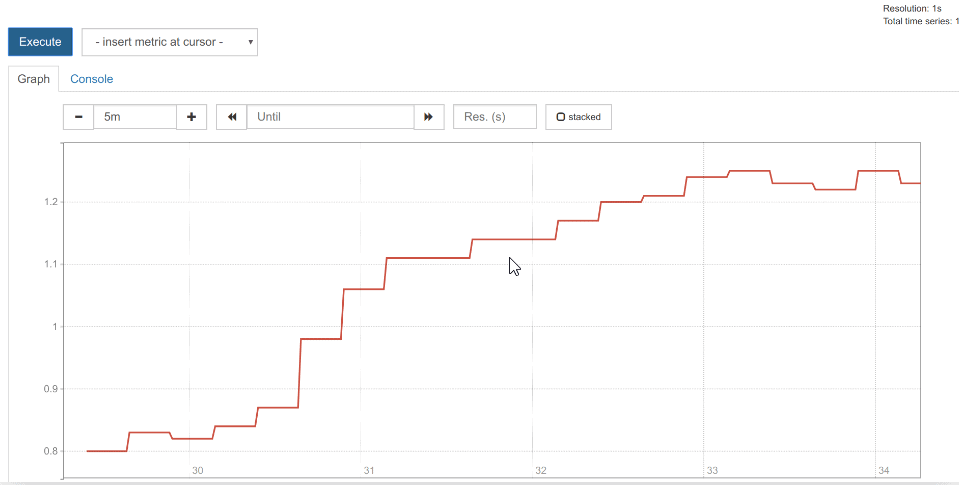
Prometheus Querying
Once the data gets stored in the database, we can query the data using PromQL. The Prometheus web UI, Grafana are the tools that help us visualise data.
Most of the monitoring mechanisms like Amazon Cloud Watch pushes the data to a centralised collection platform. But, this doesn’t seem ideal for microservices because of the traffic it might cause. Hence, the Prometheus uses the pull system from which retrieves data via multiple Prometheus instances and helps better detect a status of a service. However, Prometheus offers the push mechanism for ‘short-lived jobs’.
Check Out: Kubernetes Operator Tutorial
What is Grafana?
![]()
Grafana is an open-source mighty visualisation and analytics software. It helps us visualise massive amounts of data with the help of an excellent customisable dashboard. Therefore it helps us study, monitor, and analyse data over a period of time. It connects with a lot of data source like Prometheus, Graphite, Influx DB, ElasticSearch etc.
Features of Grafana
- The Dashboard: It is quite an excelling feature with well equipped and continually evolving part. The dashboard helps us make sense of complex data.
- Alerts: The alerts can be set up and fired whenever there is an anticipated situation.
- Native Support: It has native support of around a dozen databases.
- Built-in Support: It offers built-in support for Prometheus, Influx DB, CloudWatch, Graphite, ElasticSearch.
Also Check: Kubernetes Configmap
Install Prometheus and Grafana on Kubernetes
So, we finally have arrived at the most exciting part of the blog. Yes, we are going to helm install Prometheus Kubernetes with a Grafana web UI. But, before we get started, let’s look at some of the prerequisites.
i) You should have a Kubernetes cluster up and running. It can be of any number of nodes, minikube cluster would also do.
If you don’t have one, check out how to create a three-node Kubernetes cluster. But, don’t forget to get back here 😉
ii) Helm package manager should be installed on your machine or the Kubernetes cluster. If not, don’t worry. We got you all covered. You can install from the below commands.
For Linux:
  curl https://baltocdn.com/helm/signing.asc | sudo apt-key add -
  sudo apt-get install apt-transport-https --yes
  echo "deb https://baltocdn.com/helm/stable/debian/ all main" | sudo tee /etc/apt/sources.list.d/helm-stable-debian.list
  sudo apt-get update
  sudo apt-get install helm
For Windows:
choco install kubernetes-helm
For macOS:
brew install helm
From pkg (FreeBSD):
pkg install helm
Step 1: Add repositories
Add the following helm repositories by the commands below.
helm repo add prometheus-community https://prometheus-community.github.io/helm-charts
helm repo add stable https://charts.helm.sh/stable
Step 2: Update Helm repositories
After we add the helm repositories, we have to update the helm repo by the following command.
helm repo update
Step 3: Install Prometheus Kubernetes
helm install prometheus prometheus-community/kube-prometheus-stack
Step 4: Kubernetes Prometheus Port Forward
kubectl port-forward deployment/prometheus-grafana 3000
Step 5: Log in to Grafana
Open your favourite browser and open localhost:3000. Since you are logging in for the first time, you will have to use a default username and password. However, you can create new users and update passwords later. Use the default credentials for now:
username: admin
password: prom-operator
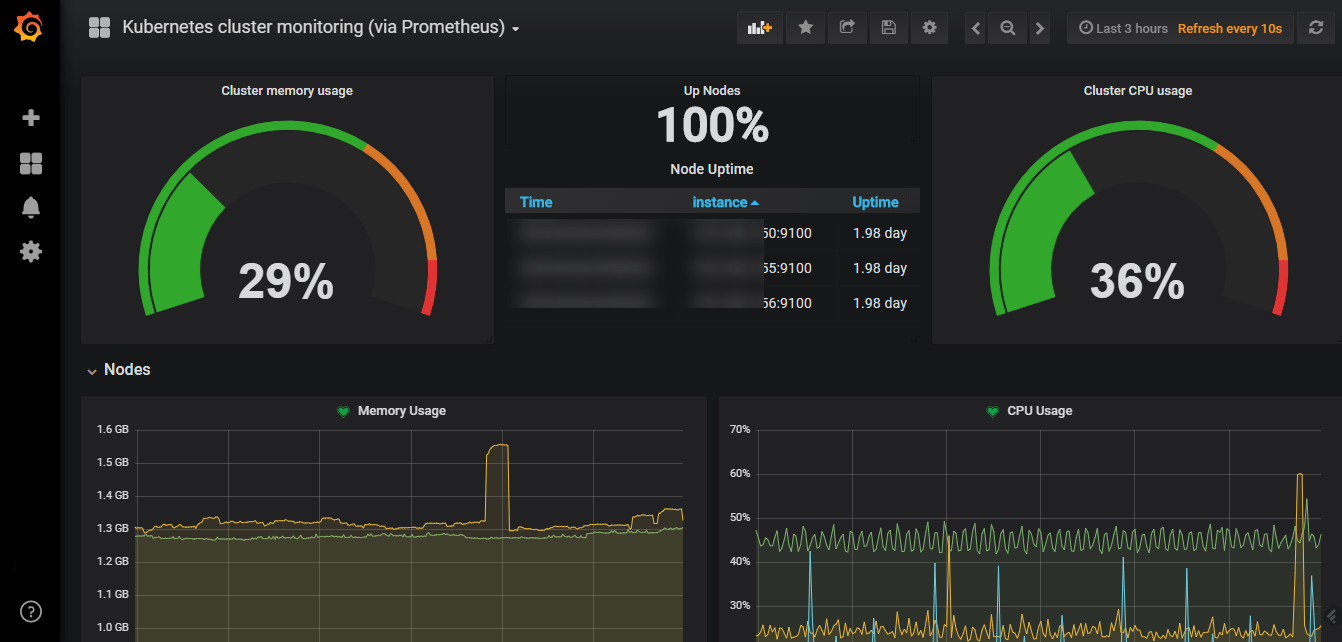
Once you are inside the Grafana web UI, there are a lot of things you can do. You can set the duration of scraping metrics. You can also configure your dashboard. Also, you can look into networking. However, there are a lot more things to explore in this. I am adding some of the scouting done by me below.
Networking in a pod:
 Cluster Status:
How to monitor a Kubernetes service with Prometheus
Services that expose Prometheus metrics using HTTP(S) have a number of advantages over competing monitoring solutions, including the following:
- Just expose a web port instead of installing a service agent. You don’t have to bother about pushing metrics or setting up a remote endpoint because Prometheus servers will routinely scrape (pull), instead.
- You may reuse the internal web server that a number of microservices currently use by just adding a folder like /metrics.
- The metrics format is understandable and legible by humans. If you are the microservice code maintainer, publishing metrics can be done right away with little effort or skill.
Some services are built from the ground up to expose Prometheus metrics (the Kubernetes kubelet, Traefik web proxy, Istio microservice mesh, etc.). Other services can be simply modified using an exporter even though they are not natively integrated. A service known as an exporter gathers service statistics and “translates” them into Prometheus metrics that are prepared for scraping. Both are illustrated in this manual.
The microservice you are installing already has a Prometheus endpoint, so let’s start there.
A reverse proxy called Traefik is made to work closely with containers and microservices. As an Ingress controller or Entrypoint, Traefik is frequently used in this manner. This acts as a link between the specific microservices in your cluster and the Internet.
Traefik can be installed in a number of ways, and there is a special installation instruction for Kubernetes. Use the following instructions to quickly set up a straightforward Traefik deployment with Prometheus support:
$ helm repo add stable https://kubernetes-charts.storage.googleapis.com/
$ helm install traefik stable/traefik --set metrics.prometheus.enabled=true
We can display the service IP, once the Traefik pods are running:
$ kubectl get svc

The new target must now be added to the prometheus.yml conf file. By using the command:
$ kubectl get cm prometheus-server -o yaml
We will see, Prometheus automatically scrapes itself:
- job_name: 'prometheus'
  # metrics_path defaults to '/metrics'
  # scheme defaults to 'http'.
  static_configs:
  - targets: ['localhost:9090']
Let’s add another static endpoint:
$ kubectl edit cm prometheus-server
Add a new job:
- job_name: 'traefik'
  static_configs:
  - targets: ['traefik-prometheus:9100]
This is, of course, the very minimum configuration; the scraping configuration supports a variety of options.
Among them are:
- basic_auth and bearer_token: Your endpoints may require authentication over HTTPS, using a classical login/password scheme or a bearer token in the request headers.
- kubernetes_sd_configs or consul_sd_configs: Different endpoint autodiscovery methods.
- scrape_interval, scrape_limit, scrape_timeout: Different tradeoffs between precision, resilience, and system load.
The Traefik endpoint should be UP if you access the /targets URL in the Prometheus web interface.
Prometheus supports a highly interesting service discovery in Kubernetes, allowing us to add targets annotating pods or services with this metadata in addition to the use of static targets in the configuration:
annotations:
  prometheus.io/port: 9216
  prometheus.io/scrape: true
We must tell Prometheus to scrape the service or pod and provide data about the port that exposes metrics.
How to monitor Kubernetes services with Prometheus exporters
Although some services and apps have already adopted the Prometheus metrics format and offer endpoints for this purpose, many well-known server programmes, such as Nginx or PostgreSQL, predate the popularisation of Prometheus metrics / OpenMetrics. Since they frequently use their own metrics formats and exposition techniques, this makes it more difficult to integrate their analytics into a single pane of glass.
This could be a problem if you’re trying to use Prometheus metrics to synchronise your metric pipeline across numerous microservices and servers.
Prometheus exporters to the rescue
The Prometheus community is building and maintaining a sizable database of Prometheus exporters in order to get past this obstacle. Using the Prometheus metrics format and HTTP protocol transports, an exporter is a “translator” or “adapter” software that may gather native server metrics (or create its own statistics by observing server activity) and re-publish them.
Source: Sysdig
These very tiny binaries can be isolated in their own pod or even in a different infrastructure, or they can be co-located as a sidecar of the main server that is being watched in the same pod.
You only need to scrape the exporter because it exposes the service metrics that have been transformed to Prometheus metrics.
Monitoring Kubernetes cluster with Prometheus and kube-state-metrics
You should monitor the Kubernetes cluster itself in addition to the services deployed in the cluster. Consider the following three aspects of cluster monitoring:
- Kubernetes hosts (nodes): Standard sysadmin metrics such as CPU, load, disc, memory, and so on.
- Orchestration level metrics: Metrics at the orchestration level include deployment state, resource requests, scheduling, and api server latency, among other things.
- Internal kube-system components: Internal kube-system components include detailed service metrics for the scheduler, controller manager, DNS service, and other components.
Kubernetes monitoring components on a Prometheus stack
cAdvisor is a container resource usage and performance analysis agent that is open source. It is designed specifically for containers and natively supports Docker containers. cAdvisor runs as part of the Kubelet binary in Kubernetes. As a result, any aggregator retrieving “node local” and Docker metrics will scrape the Kubelet Prometheus endpoints directly.
Kube-state-metrics is a straightforward service that listens to the Kubernetes API server and generates metrics about the state of objects like deployments, nodes, and pods. It should be noted that kube-state-metrics is simply a metrics endpoint. Other organisations must scrape it and provide long-term storage (e.g., the Prometheus server).
Metrics-server is a cluster-wide resource usage data aggregator. The metrics server will only display the most recent data points and is not responsible for long-term storage.
Thus:
- Kube-state metrics are concerned with orchestration metadata such as deployment, pod, and replica status.
- Metrics-server is primarily concerned with implementing the resource metrics API, which includes CPU, file descriptors, memory, request latencies, and so on.
Monitoring the Kubernetes nodes with Prometheus
Kubernetes nodes and hosts must be monitored. We have many tools for monitoring a Linux host, but they are not designed to run easily on Kubernetes. As a result, we’ll employ the Prometheus node-exporter, which was designed with containers in mind:
- The Prometheus project itself hosts it.
- It is the one that will be deployed automatically in our Prometheus operator examples.
- It is deployable as a DaemonSet and will automatically scale as nodes are added or removed from your cluster.
Using Helm is the simplest way to install it:
# add repo only needed if it wasn't done before
helm repo add prometheus-community https://prometheus-community.github.io/helm-charts
# Helm 3
helm install [RELEASE_NAME] prometheus-community/prometheus-node-exporter
# Helm 2
helm install --name [RELEASE_NAME] prometheus-community/prometheus-node-exporter
After installing and running the chart, you can display the service that needs to be scraped:
TYPE        CLUSTER-IP       EXTERNAL-IP   PORT(S)                                     AGE
node-exporter-prometheus-node-exporter   ClusterIP   10.101.57.207    <none>        9100/TCP                                    17m
Once you’ve added the scrape config (if you installed Prometheus with Helm, there’s no need to configure anything because it works out-of-the-box), you can begin collecting and displaying node metrics.
Monitoring kube-state-metrics with Prometheus
It only takes a few steps to deploy and monitor the kube-state-metrics.
Again, you can use the commands below to deploy it directly or with a Helm chart. If you used Helm to install Prometheus, kube-state-metrics will already be installed, so you can skip this step.
git clone https://github.com/kubernetes/kube-state-metrics.git
kubectl apply -f examples/standard
...
# kubectl get svc -n kube-system
NAME                 TYPE        CLUSTER-IP       EXTERNAL-IP   PORT(S)             AGE
kube-dns             ClusterIP   10.96.0.10       <none>        53/UDP,53/TCP       13h
kube-state-metrics   ClusterIP   10.102.12.190    <none>        8080/TCP,8081/TCP   1h
Simply scrape that service (port 8080) in the Prometheus configuration. This time, remember to use the FQDN:
- job_name: 'kube-state-metrics'
  static_configs:
  - targets: ['kube-state-metrics.kube-system.svc.cluster.local:8080']
Conclusion
Monitoring is crucial whether you are experimenting or using the production-based cluster. Prometheus Kubernetes monitoring with Grafana is a boon for us indeed. It makes our lives a lot easier with a customisable interface, configurable exporters. Also, it is open-source. However, K8s has its official dashboard, and the Prometheus + Grafana is no match.
We have used Helm to deploy the Prometheus operator, including all the necessary tools for Prometheus and Grafana to monitor the cluster. So, you would have figured out why Prometheus and Grafana for Kubernetes are a superpower. If no yet, I suggest you install the Prometheus and Grafana on Kubernetes and have a look at the various features it has to offer for us!
Related Post
- Kubernetes for Beginners
- Kubernetes Operator: An Overview, Stateful Application Example
- How To Setup A Three Node Kubernetes Cluster For CKA: Step By Step
- Check out and Subscribe to our YouTube channel on “Docker & Kubernetes.”
- Certified Kubernetes Administrator (CKA) Certification Exam
- Certified Kubernetes Administrator (CKA) Certification: Step By Step Activity Guides/Hands-On Lab Exercise
- [Solved] The connection to the server localhost:8080 was refused
- CKA/CKAD Exam Questions & Answers
- Etcd Backup And Restore In Kubernetes: Step By Step
Join FREE Class
Discover the Power of Kubernetes, Docker & DevOps – Join Our Free Masterclass. Unlock the secrets of Kubernetes, Docker, and DevOps in our exclusive, no-cost masterclass. Take the first step towards building highly sought-after skills and securing lucrative job opportunities. Click on the below image to Register Our FREE Masterclass Now!


thanks for the tutorial.
How do I add LDAP to grafana? I know I I need grafana.ini or values.yaml from grafana but how do you pass them with prometheous-stack installation
Thanks
Hi Sy,
Locate the values.yaml file within the Helm chart directory or archive. You’ll need to add Grafana LDAP configuration settings to this file.
grafana:
enabled: true
ldap:
enabled: true
config:
allow_sign_up: true
ldap_config_file: /etc/grafana/ldap.toml # Path to LDAP configuration file
servers:
– host: ldap.example.com
port: 389 # Your LDAP server port
use_ssl: false
start_tls: false
bind_dn: “cn=admin,dc=example,dc=com” # LDAP bind DN
bind_password: “your_password” # LDAP bind password
search_filter: “(cn=%s)” # Search filter
search_base_dns:
– “dc=example,dc=com” # Base DN
group_search_filter: “(&(objectClass=groupOfNames)(member=%s))”
You’ll need to create the LDAP configuration file (ldap.toml in this example) as specified in the ldap_config_file path above. Here is an example LDAP configuration:
[[servers]]
host = “ldap.example.com”
port = 389
use_ssl = false
start_tls = false
bind_dn = “cn=admin,dc=example,dc=com”
bind_password = “your_password”
search_filter = “(cn=%s)”
search_base_dns = [“dc=example,dc=com”]
group_search_filter = “(&(objectClass=groupOfNames)(member=%s))”
Hope this helps.
Thanks & Regards
Sahid
Team K21Academy